Power BI
How to Integrate Samsara with Power BI
Introduction
For your organization's data analytics and data visualization needs, you may use Power BI. Power BI has a capability to install Power Query Connectors to access data from different systems, such as Samsara, right within Power BI. There are two paths you can take to get access to such a connector:
- Power BI Connector (Offered by Samsara) -- this is a plug-and-play connector that you can directly install (provided by Samsara) without needing to write any code. This connector is currently in Beta. For requesting access, reach out to your Samsara point-of-contact or Samsara Support. Learn more about the connector here.
- Custom-built Connector (Built by your Technical Team) -- if you want to control the logic of how the data gets into Power BI or prefer to build a connector that's tailored specifically to a table design you are looking for, you can build your own custom connector. This takes effort, and writing code in "M", which is Microsoft's proprietary language.
The rest of the guide focuses on enabling you to build Custom-built Connectors
Power BI Background
Before diving into the specifics, if you aren't familiar with Power Query and M code, which is the proprietary Microsoft coding platform used to build Power BI connectors, we recommend reviewing the "Deep Dive into the M Language" YouTube video. Here are some helpful timestamps to narrow in on certain topics:
| Topic | Timestamps |
|---|---|
| Data Connector Applications | 1:50 to 3:54 |
| Data Flow with Power BI | 4:11 to 5:10 |
| M Language Basics | 9:15 to 10:18 |
| M Language Query Structure | 10:18 to 12:45 |
| Tables Using Power BI | 17:38 to 19:52 |
| Demo, Connecting with REST API | 21:35 |
| Connect data source | 24:19 to 34:46 |
| Build & Deploy | 34:46 to 35:26 |
| Accessing your function via BI Desktop | 35:26 to 36:09 |
| Data Transformation Example | 36:09 to 37:33 |
| Creating the final Query for Table export with Data transformation | 37:33 to 39:00 |
| Create a Sample Report | 42:31 to 43:01 |
| Summary | 45:05 |
Microsoft Power Query
Prerequisite
- A Samsara API token generated via the Samsara Dashboard with at least read-only access.
- Access to Power BI Desktop
Power Query Editor can be found built-in to many versions of Microsoft data tools such as Excel and Power BI Desktop. Typically, the way to access the Samsara API via this tool is to find the "Get Data" menu option, select "From Other Sources", and create a "Blank Query." We have found that it is the easiest to start with a Blank Query.
Power Query Example: Trips
Samsara telematics devices allow customers to track where their fleets have been going - one relevant metric is a Trip (i.e. the distance traveled, start, and end destination of a given vehicle). This data is available via the /v1/fleet/trips API endpoint.
Prerequisites for Trips Example (Basic; v1 endpoint) query
- A Samsara API token
- A beginning timestamp in Unix time (startMs referenced in the query below; e.g. 1654066800000)
- An ending timestamp in Unix time (endMs referenced in the query below; e.g. 1656658799000)
- One Samsara vehicle ID
The vehicle IDs referenced here are Samsara-generated internal IDs. These can be found by either calling on the GET /fleet/vehicles API endpoint
let parameters = (startMs as text,endMs as text, vehicleId as text) =>
    let
        accessToken = "YOUR ACCESS TOKEN",
        baseUrl = "https://api.samsara.com/",
        endpointUrl = "/v1/fleet/trips",
        initialRequest = Json.Document(Web.Contents(baseUrl,[RelativePath = endpointUrl & "?startMs=" & startMs & "&endMs=" & endMs & "&vehicleId=" & vehicleId, Headers = [Authorization = "Bearer " & accessToken]]))
    in
        initialRequest
in
parameters
Power Query Example: Safety Events and Pagination
With Samsara's List All Safety Events API endpoint, it's possible to retrieve your entire fleet's (or a sub-section of it defined individually by a list of vehicles or Tags) Safety Events within a defined time frame.
Prerequisites for Safety Events Example (v2 endpoint with Pagination) query
- A Samsara API token
- A startTime in RFC3339 format (startTime referenced in the query below; e.g. 2022-06-01T00:00:00-08:00)
- An endTime in RFC3339 format (endTime referenced in the query below; e.g. 2022-06-30T00:00:00-08:00)
Please make note that unlike the Trips v1 API endpoint, the List All Safety Events v2 API endpoint returns responses in separate pages (i.e. with pagination). Your query will need to account for this by checking for the "hasNextPage" value; if it is "true", this indicates there are subsequent pages with data that need to be requested by assigning the returned "endCursor" as the value for the "after" parameter in the following call until "hasNextPage" returns "false".
let parameters = (startTime as text,endTime as text) =>
    let
        accessToken = "YOUR ACCESS TOKEN",
        baseUrl = "https://api.samsara.com/",
        endpointUrl = "fleet/safety-events",
        initialRequest = Json.Document(Web.Contents(baseUrl,[RelativePath= endpointUrl&"?startTime="&startTime&"&endTime="&endTime, Headers=[Authorization = "Bearer "&accessToken]])),
        nextUrl = if initialRequest[pagination][hasNextPage] = false then null else initialRequest[pagination][endCursor],
        initialValue= initialRequest[data],
        dataCollection=(data as list, url)=>
            let
                newRequest=Json.Document(Web.Contents(baseUrl,[RelativePath= endpointUrl&"?startTime="&startTime&"&endTime="&endTime&"&after="&url, Headers=[Authorization = "Bearer "&accessToken]])),
                newNextUrl = if newRequest[pagination][hasNextPage] = false then null else newRequest[pagination][endCursor],
                newData= newRequest[#"data"],
                dataCombined=List.Combine({data,newData}),
                check = if newRequest[pagination][hasNextPage] = true then @dataCollection(dataCombined, newNextUrl) else dataCombined
            in
                check,
                outputList= if initialRequest[pagination][hasNextPage]= true then @dataCollection(initialValue,nextUrl) else initialValue
    in
        outputList
in
    parameters
Creating Data Sources from Queries
Now that you have a query to Samsara's REST API set up (see examples above for more), the next step is to take that query and create a Power BI data source that can be accessed by your dashboards and visualizations.
Step 1: Save your Query
- Create a new Power BI project and select “Blank Query” under “Get Data” and click “Connect”.

- Select "Query" and then navigate "Advanced Editor" and paste the above code snippet in the query box. (Note: Please add the Samsara API Key in the example)
- Click "Done".
- Once the above steps are completed, you will be prompted to enter the relevant parameters. Enter these fields and click "invoke". (Refer to the above examples regarding what these parameters are)


Step 2: Authenticate to Samsara's API
- If the API key is already entered in the Query then click "connect" if not enter the API credentials.

- If the Query is executed successfully, the output will be in a "list" format.

Step 3: Data Transformations
- To Convert the output into a table, click on "To Table" and then select "OK"

- The Output will be in a Tabular format. Select the columns which you want to display in your table and click "OK".

- To perform further data transformations, you can also edit the Table query.

Once you've completed data transformations, you will have and updated Function in Power Query Editor. The Function should look similar to the examples below:
let
    Source = Query1("VALUE FROM startMs PARAMETER", "VALUE FROM endMs PARAMETER", "VALUE FROM vehicleId PARAMETER"),
    #"Converted to Table" = Record.ToTable(Source),
    #"Expanded Value" = Table.ExpandListColumn(#"Converted to Table", "Value"),
    #"Expanded Value1" = Table.ExpandRecordColumn(#"Expanded Value", "Value", {"startMs", "endMs", "startLocation", "endLocation", "startAddress", "endAddress", "startCoordinates", "endCoordinates", "distanceMeters", "fuelConsumedMl", "tollMeters", "driverId", "codriverIds", "startOdometer", "endOdometer", "assetIds"}, {"Value.startMs", "Value.endMs", "Value.startLocation", "Value.endLocation", "Value.startAddress", "Value.endAddress", "Value.startCoordinates", "Value.endCoordinates", "Value.distanceMeters", "Value.fuelConsumedMl", "Value.tollMeters", "Value.driverId", "Value.codriverIds", "Value.startOdometer", "Value.endOdometer", "Value.assetIds"}),
    #"Expanded Value.startAddress" = Table.ExpandRecordColumn(#"Expanded Value1", "Value.startAddress", {"id", "name", "address"}, {"Value.startAddress.id", "Value.startAddress.name", "Value.startAddress.address"}),
    #"Expanded Value.endAddress" = Table.ExpandRecordColumn(#"Expanded Value.startAddress", "Value.endAddress", {"id", "name", "address"}, {"Value.endAddress.id", "Value.endAddress.name", "Value.endAddress.address"}),
    #"Expanded Value.startCoordinates" = Table.ExpandRecordColumn(#"Expanded Value.endAddress", "Value.startCoordinates", {"latitude", "longitude"}, {"Value.startCoordinates.latitude", "Value.startCoordinates.longitude"}),
    #"Expanded Value.endCoordinates" = Table.ExpandRecordColumn(#"Expanded Value.startCoordinates", "Value.endCoordinates", {"latitude", "longitude"}, {"Value.endCoordinates.latitude", "Value.endCoordinates.longitude"}),
    #"Expanded Value.codriverIds" = Table.ExpandListColumn(#"Expanded Value.endCoordinates", "Value.codriverIds"),
    #"Expanded Value.assetIds" = Table.ExpandListColumn(#"Expanded Value.codriverIds", "Value.assetIds")
in
#"Expanded Value.assetIds"let
Source = Query1("VALUE FROM startTime PARAMETER", "VALUE FROM endTime PARAMETER"),
#"Converted to Table" = Table.FromList(Source, Splitter.SplitByNothing(), null, null, ExtraValues.Error),
#"Expanded Column1" = Table.ExpandRecordColumn(#"Converted to Table", "Column1", {"id", "driver", "vehicle", "time", "maxAccelerationGForce", "downloadForwardVideoUrl", "location", "coachingState", "behaviorLabels"}, {"Column1.id", "Column1.driver", "Column1.vehicle", "Column1.time", "Column1.maxAccelerationGForce", "Column1.downloadForwardVideoUrl", "Column1.location", "Column1.coachingState", "Column1.behaviorLabels"}),
#"Expanded Column1.driver" = Table.ExpandRecordColumn(#"Expanded Column1", "Column1.driver", {"id", "name"}, {"Column1.driver.id", "Column1.driver.name"}),
#"Expanded Column1.vehicle" = Table.ExpandRecordColumn(#"Expanded Column1.driver", "Column1.vehicle", {"id", "name"}, {"Column1.vehicle.id", "Column1.vehicle.name"}),
#"Expanded Column1.location" = Table.ExpandRecordColumn(#"Expanded Column1.vehicle", "Column1.location", {"latitude", "longitude"}, {"Column1.location.latitude", "Column1.location.longitude"}),
#"Expanded Column1.behaviorLabels" = Table.ExpandListColumn(#"Expanded Column1.location", "Column1.behaviorLabels"),
#"Expanded Column1.behaviorLabels1" = Table.ExpandRecordColumn(#"Expanded Column1.behaviorLabels", "Column1.behaviorLabels", {"label", "source", "name"}, {"Column1.behaviorLabels.label", "Column1.behaviorLabels.source", "Column1.behaviorLabels.name"})
in
#"Expanded Column1.behaviorLabels1"Step 4: Load the Data Source
From here, you'll be able to "Close & Load" your Data Source, which will populate your Excel sheet or Power BI Report with the data you've pulled via Power Query Editor.
(Optional) Incremental Refresh
What is Incremental Refresh in Power BI?
Incremental refresh is a method that Power BI uses to update data stored in a report or dashboard. Instead of recreating an entire dataset from scratch each time a dataset is refreshed, Power BI only loads new or updated data since the last refresh. This method significantly reduces the load on your data sources and improves the performance of your reports.
Requirements for Incremental Refresh
- Data Source should support filtering by date at source. PowerBI requires users to create two Parameters RangeStart and RangeEnd which are used to filter data at source. Most Samsara APIs require a start and end timestamp so this requirement is met.
- Final Dataset should have at least one date/time column that can be used to filter the data.
Building reports with Incremental Refresh
Use Case Introduction
The following example demonstrates implementation of incremental refresh to fetch and maintain a rolling 120 day window of Fuel and Energy Efficiency data from Samsara APIs. The dataset upon deployment on to PowerBI Service will refresh daily to retrieve previous day’s data and drop data older than 120 days.
Step 1 - Create required parameters
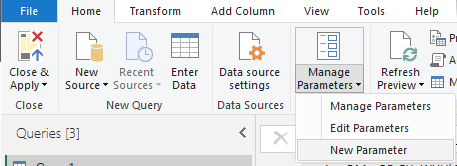
- In Power BI Desktop, select Transform data on the Home ribbon to open Power Query Editor.
- Select the Manage Parameters dropdown and then choose New Parameter.
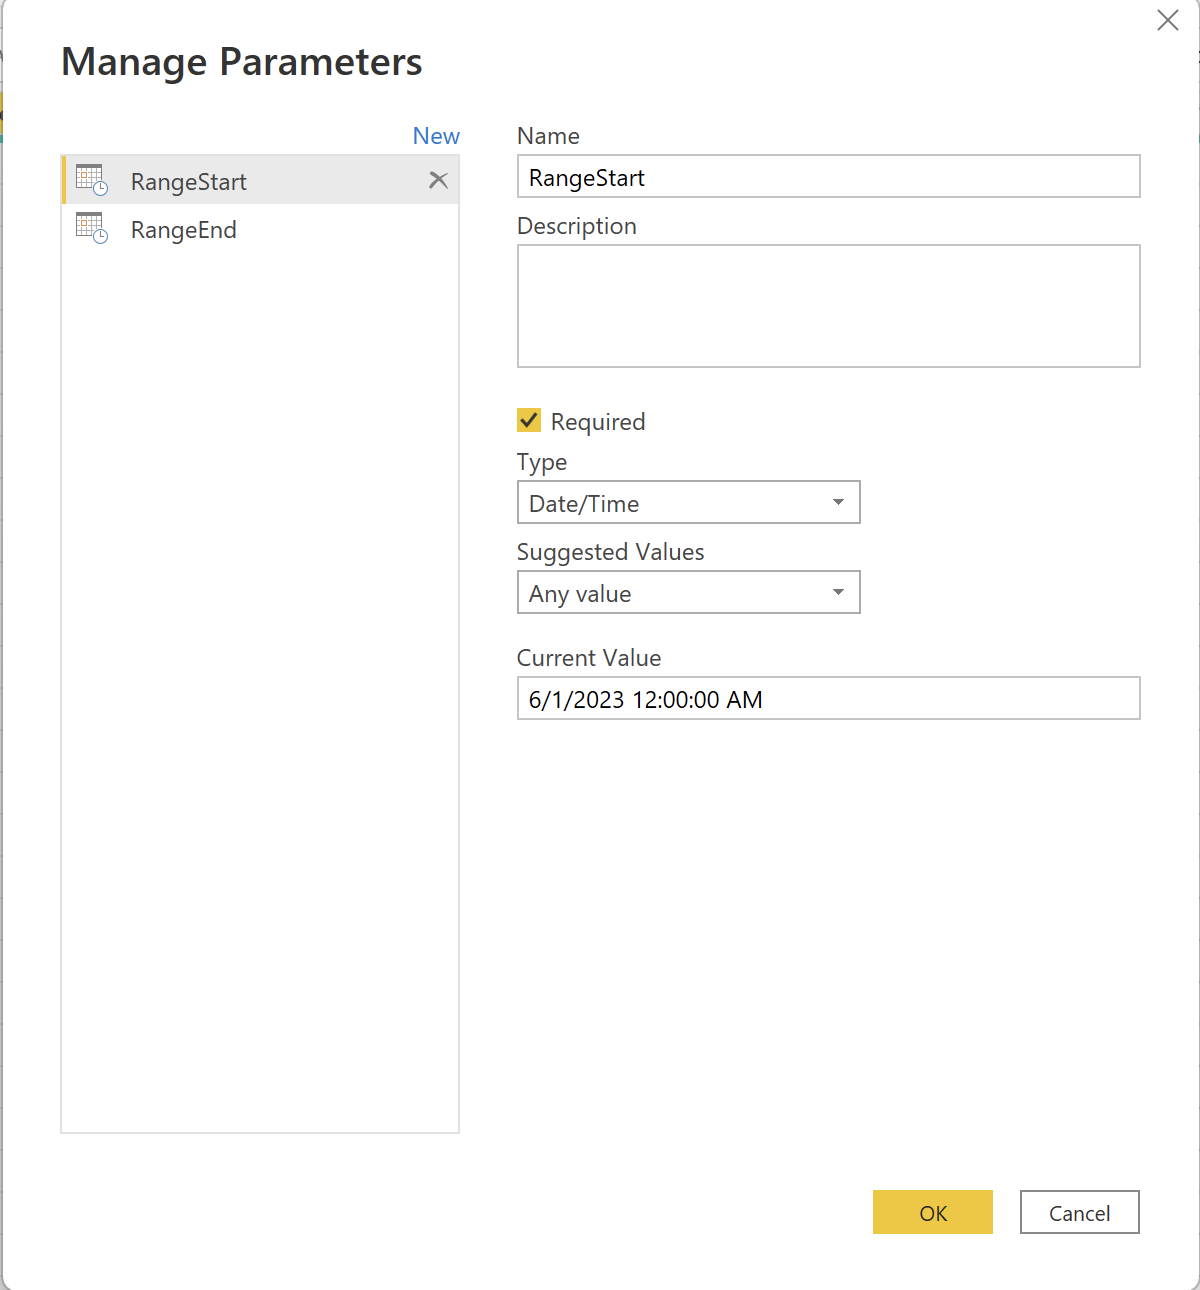
- In the Name field, enter RangeStart (case-sensitive). In the Type field, select Date/Time from the dropdown. In the Current Value field, enter a start date and time value in MM/DD/YYYY HH:MM:SS.
- Define the RangeStart parameter in the Manage Parameters dialog.
- Select New to create a second parameter named RangeEnd. In the Type field, select Date/Time, and then in the Current Value field enter an end date and time value. Select OK.
- Define the RangeEnd parameter in the Manage Parameters dialog.
- Now that you've defined the RangeStart and RangeEnd parameters, you'll filter the data to be loaded into the model based on those parameters.
Step 2 - Retrieve and transform FEER data
The following query retrieves data from GET Fuel and Energy Efficiency Vehicle Reports API. A RFC3339 transformed version of StartRange and EndRange parameters configured in the previous step are used to retrieve only the required data. The initial refresh fetches the entire 120 day window and the subsequent refreshes will only fetch the previous day’s data.
let
    accessToken = "Your API Token",
    baseUrl = "https://api.eu.samsara.com/",
    endpointUrl = "fleet/reports/vehicles/fuel-energy",

    endDate = RangeEnd,
    startDate = RangeStart,


getData = (startD as datetime, endD as datetime) =>

        let

            strRangeStart = DateTime.ToText(startD,[Format="yyyy-MM-dd'T'HH:mm:ss'Z'", Culture="en-US"]),
            strRangeEnd = DateTime.ToText(endD,[Format="yyyy-MM-dd'T'HH:mm:ss'Z'", Culture="en-US"]),

            initialRequest = Json.Document(Web.Contents(baseUrl,[RelativePath= endpointUrl&"?startDate="&strRangeStart&"&endDate="&strRangeEnd, Headers=[Authorization = "Bearer "&accessToken]])),
            nextUrl = if initialRequest[pagination][hasNextPage] = false then null else initialRequest[pagination][endCursor],
            initialValue= initialRequest[data][vehicleReports],

        dataCollection = (data as list, url) =>
            let
                newRequest=Json.Document(Web.Contents(baseUrl,[RelativePath= endpointUrl&"?startDate="&strRangeStart&"&endDate="&strRangeEnd&"&after="&url, Headers=[Authorization = "Bearer "&accessToken]])),
                newNextUrl = if newRequest[pagination][hasNextPage] = false then null else newRequest[pagination][endCursor],
                newData= newRequest[#"data"][#"vehicleReports"],
                dataCombined=List.Combine({data,newData}),
                check = if newRequest[pagination][hasNextPage] = true then @dataCollection(dataCombined, newNextUrl) else dataCombined
            in
                check,
                outputList= if initialRequest[pagination][hasNextPage]= true then @dataCollection(initialValue,nextUrl) else initialValue,
                outputTable = Table.FromRecords(outputList),
                timestampColumn = Table.AddColumn(outputTable, "timestamp (UTC)", each startD, type datetime)
        in
            timestampColumn,


    // Create a list of days between the start and end dates and apply getData function to each day
    dates = List.DateTimes(startDate, Duration.TotalDays(endDate - startDate), #duration(1, 0, 0, 0)),
    outputData = List.Transform(dates, each getData(_, _)),

    // Combine the transformed tables into a single table
    combinedTable = Table.Combine(outputData),

    // Expand the columns
    #"Expanded vehicle" = Table.ExpandRecordColumn(combinedTable, "vehicle", {"energyType", "id", "name", "externalIds"}, {"vehicle.energyType", "vehicle.id", "vehicle.name", "vehicle.externalIds"}),
    #"Filtered Rows" = Table.SelectRows(#"Expanded vehicle", each true),
    #"Expanded estFuelEnergyCost" = Table.ExpandRecordColumn(#"Filtered Rows", "estFuelEnergyCost", {"amount", "currencyCode"}, {"estFuelEnergyCost.amount", "estFuelEnergyCost.currencyCode"}),
    #"Filtered Rows1" = Table.SelectRows(#"Expanded estFuelEnergyCost", each true)

    #"Changed Type" = Table.TransformColumnTypes(#"Filtered Rows1",{{"engineRunTimeDurationMs", type number}, {"engineIdleTimeDurationMs", type number}, {"estFuelEnergyCost.amount", type number}, {"estCarbonEmissionsKg", type number}, {"distanceTraveledMeters", type number}, {"fuelConsumedMl", type number}, {"energyUsedKwh", type number}, {"efficiencyMpge", type number}})

in
    #"Changed Type"
Step 3 - Filter data
You'll now apply a filter based on conditions in the RangeStart and RangeEnd parameters.
- In Power Query Editor, select the “timestamp (UTC)” column, and then choose the dropdown arrow > Date/Time Filters > Custom Filter.
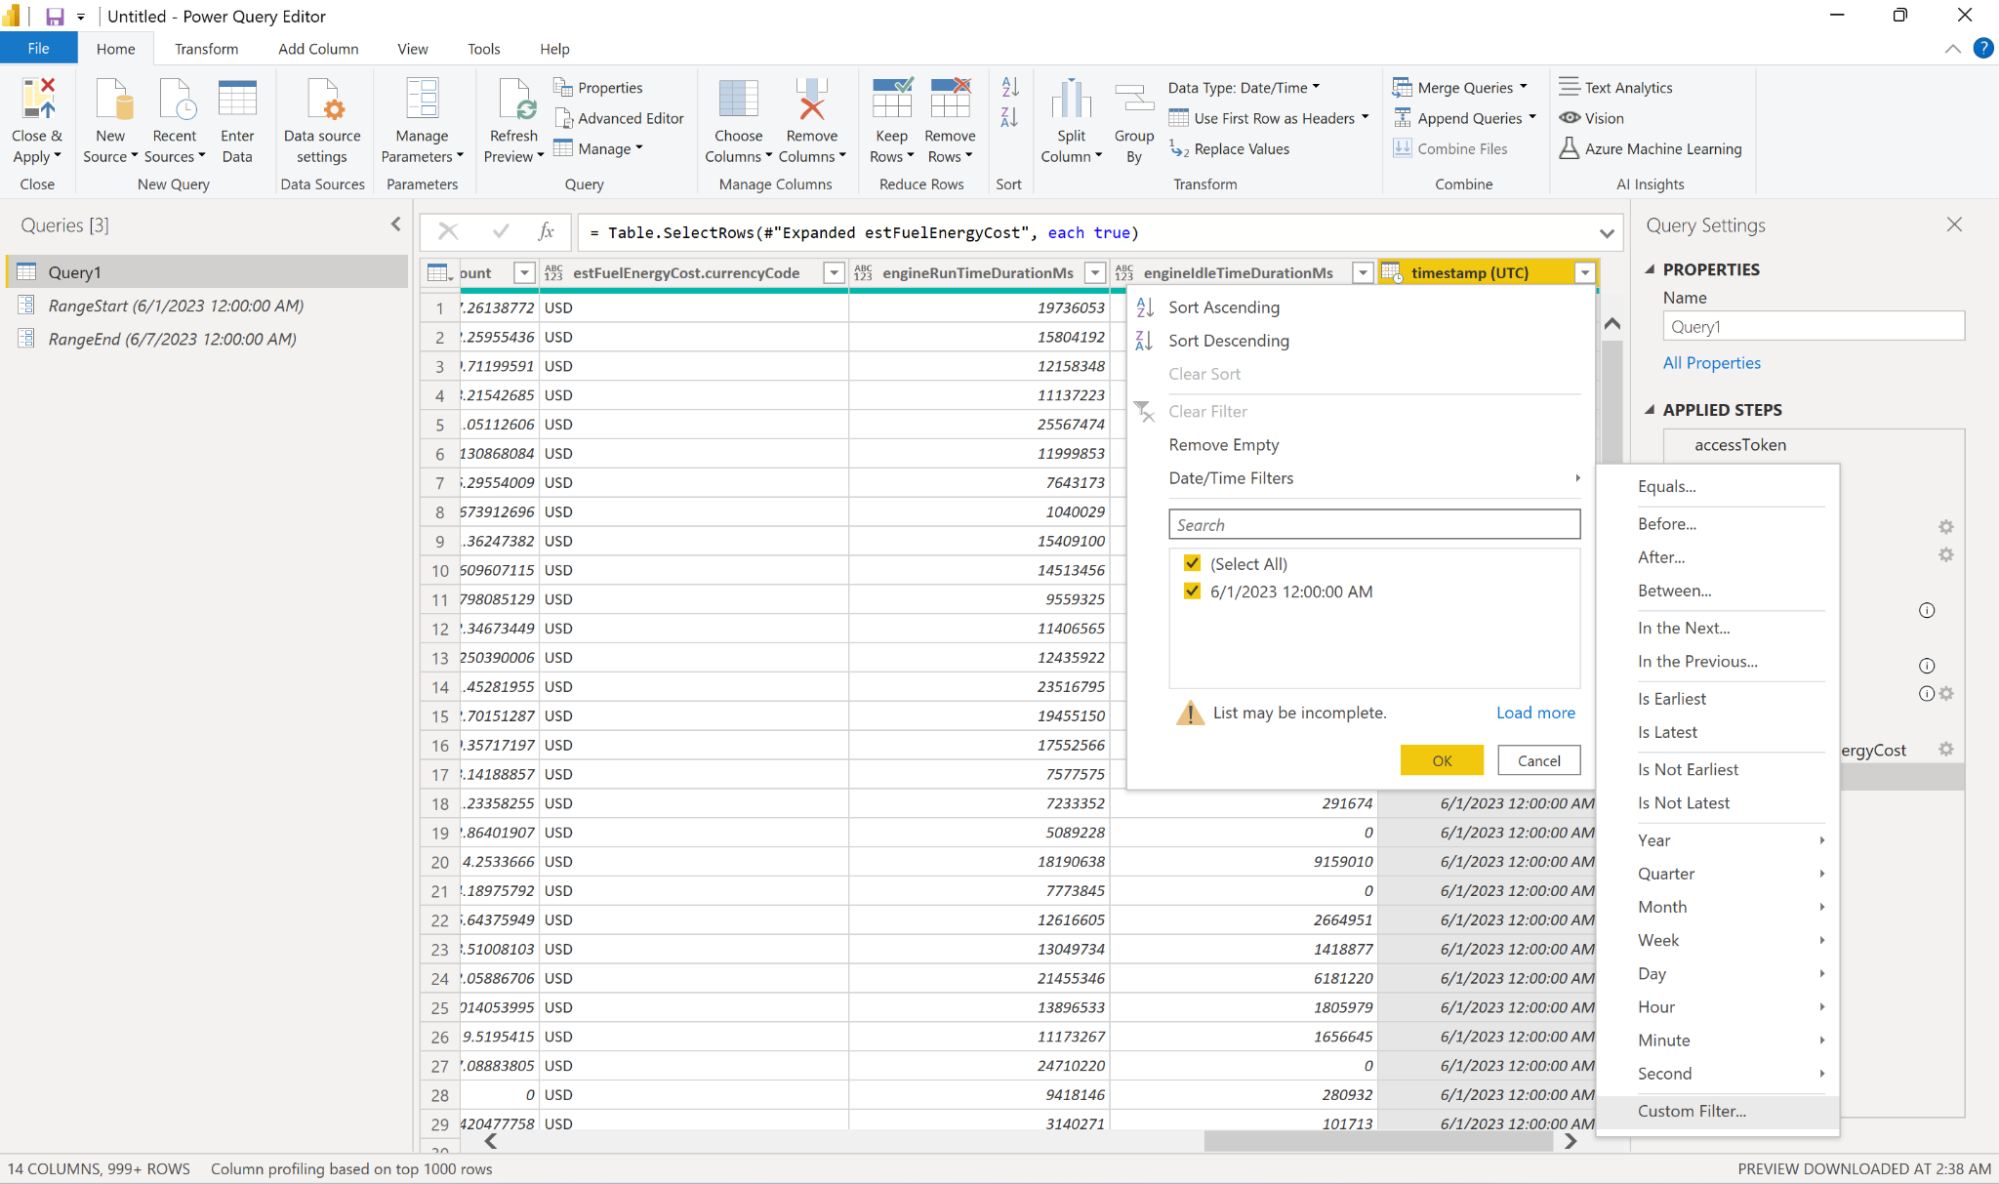
- In Filter Rows, to specify the first condition, select “is after” or “is after or equal to”, then choose Parameter, and then choose RangeStart.
- To specify the second condition:
- If you selected “is after” in the first condition, then choose “is before or equal to”,
- If you selected “is after or equal to” in the first condition, then choose “is before” for the second condition.
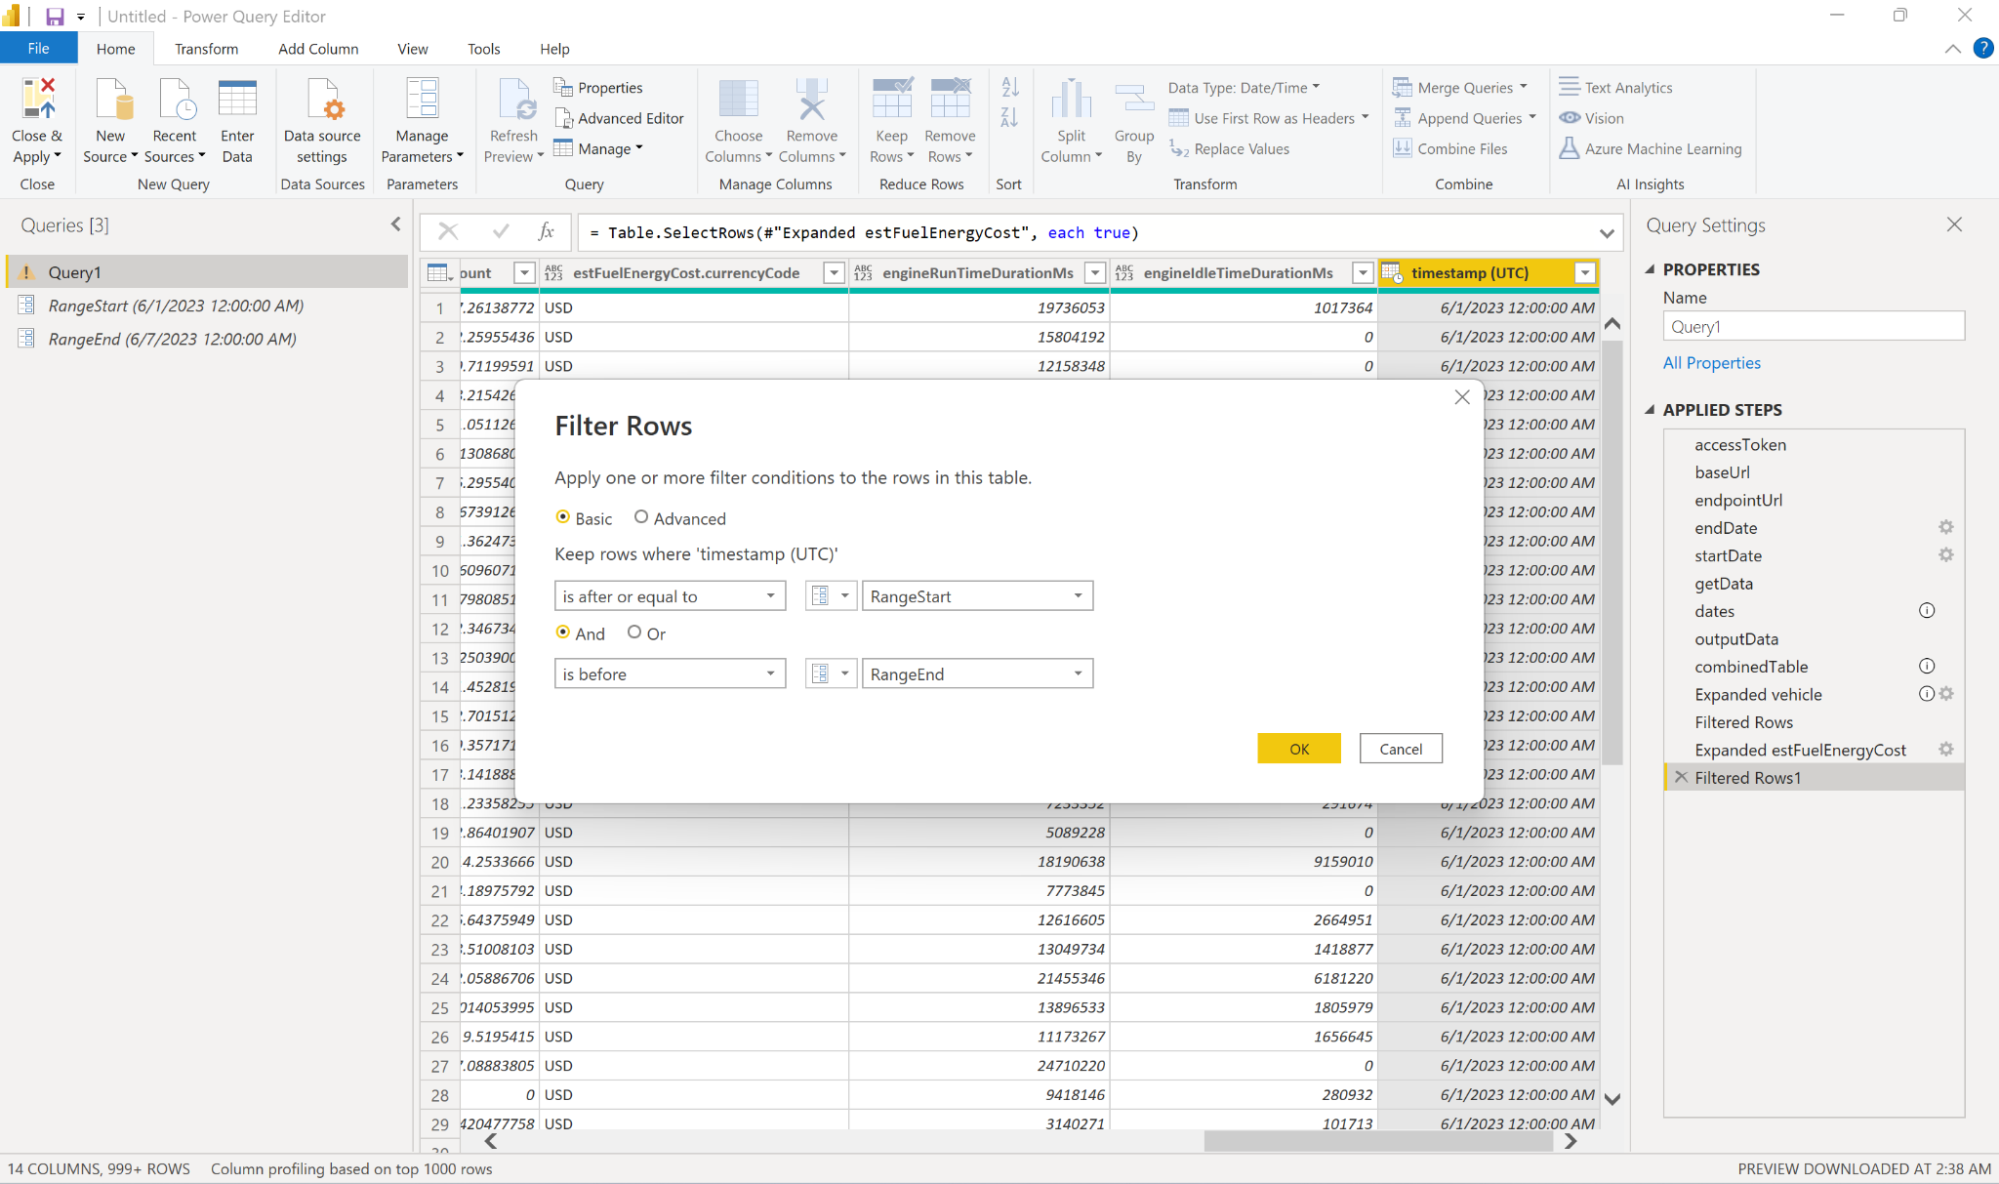
- On the Home ribbon in Power Query Editor, select Close & Apply. Power Query loads data based on the filters defined by the RangeStart and RangeEnd parameters, and any other filters you've defined.
Step 4 - Configure Incremental Refresh Policy
After you've defined RangeStart and RangeEnd parameters, and filtered data based on those parameters, you'll define an incremental refresh policy. This policy is applied only after the model is published to the service, and a manual or scheduled refresh operation is performed.
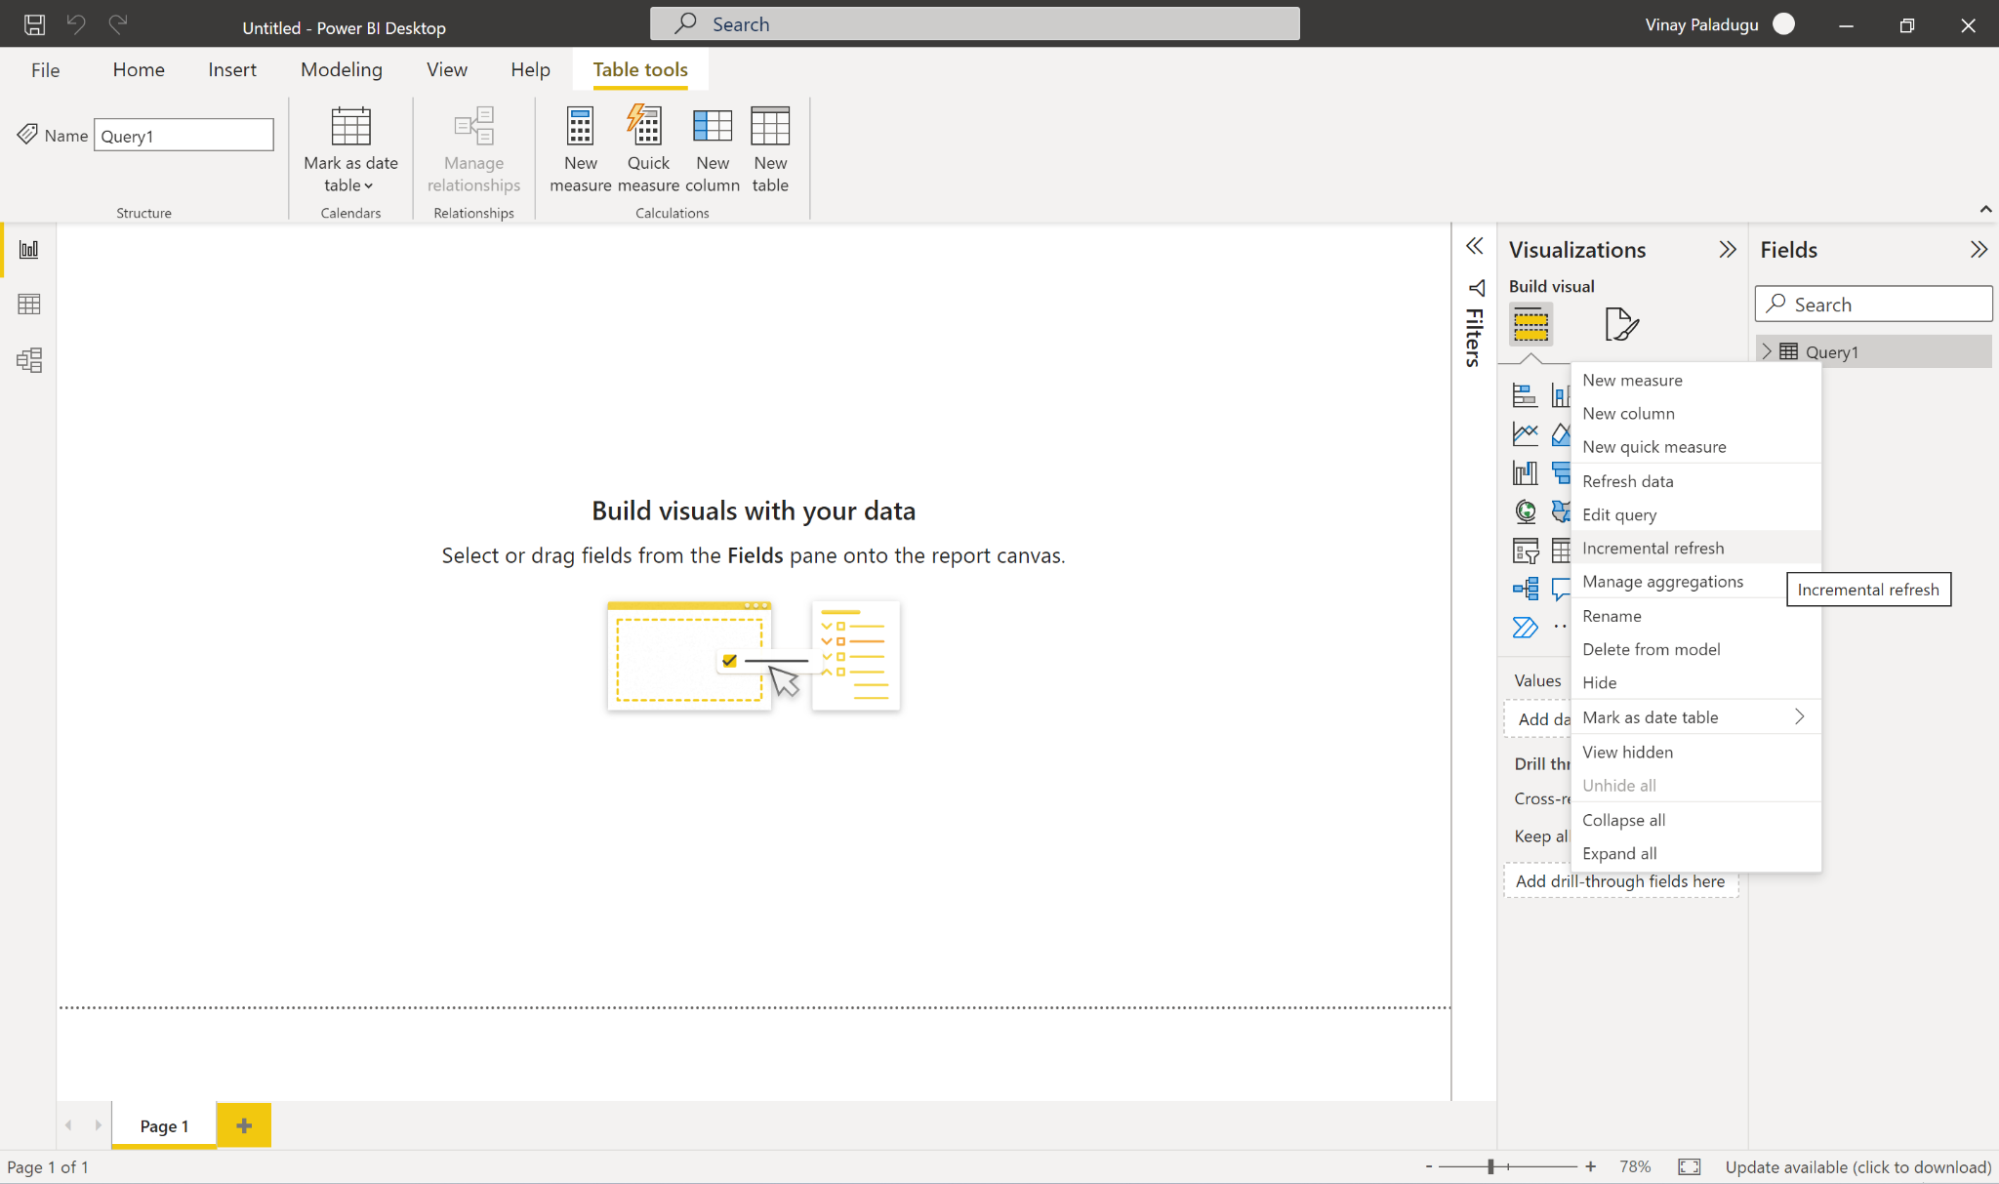
- In the Data view, right-click your Query table in the Data pane and select Incremental refresh.
- In Incremental refresh and real-time data > Select table, verify or select the table. The default value of the Select table listbox is the table you selected in Data view.
- In Set import and refresh ranges > Incrementally refresh this table move the slider to On.
- In Archive data starting, specify 120 Days since we want to store the last 120 days in the dataset. All rows with dates in this period will be loaded into the dataset in the service.
PowerBI caps the number of historical days to 120.
- For any use cases that require more historical data, please reach out to your account team to get in touch with the Samsara Solution Integrations Services team that can further assist you.
- In Incrementally refresh data starting, specify 1 Days. All rows with dates in this period will be refreshed in the dataset each time a manual or scheduled refresh operation is performed by the Power BI service.
- Select Only refresh complete days to refresh only whole days. If the refresh operation detects a day isn't complete, rows for that whole day aren't refreshed. This is important since we do not want the dataset to include data for the part of the day that is between 12:00 AM and when the daily refresh is scheduled for.
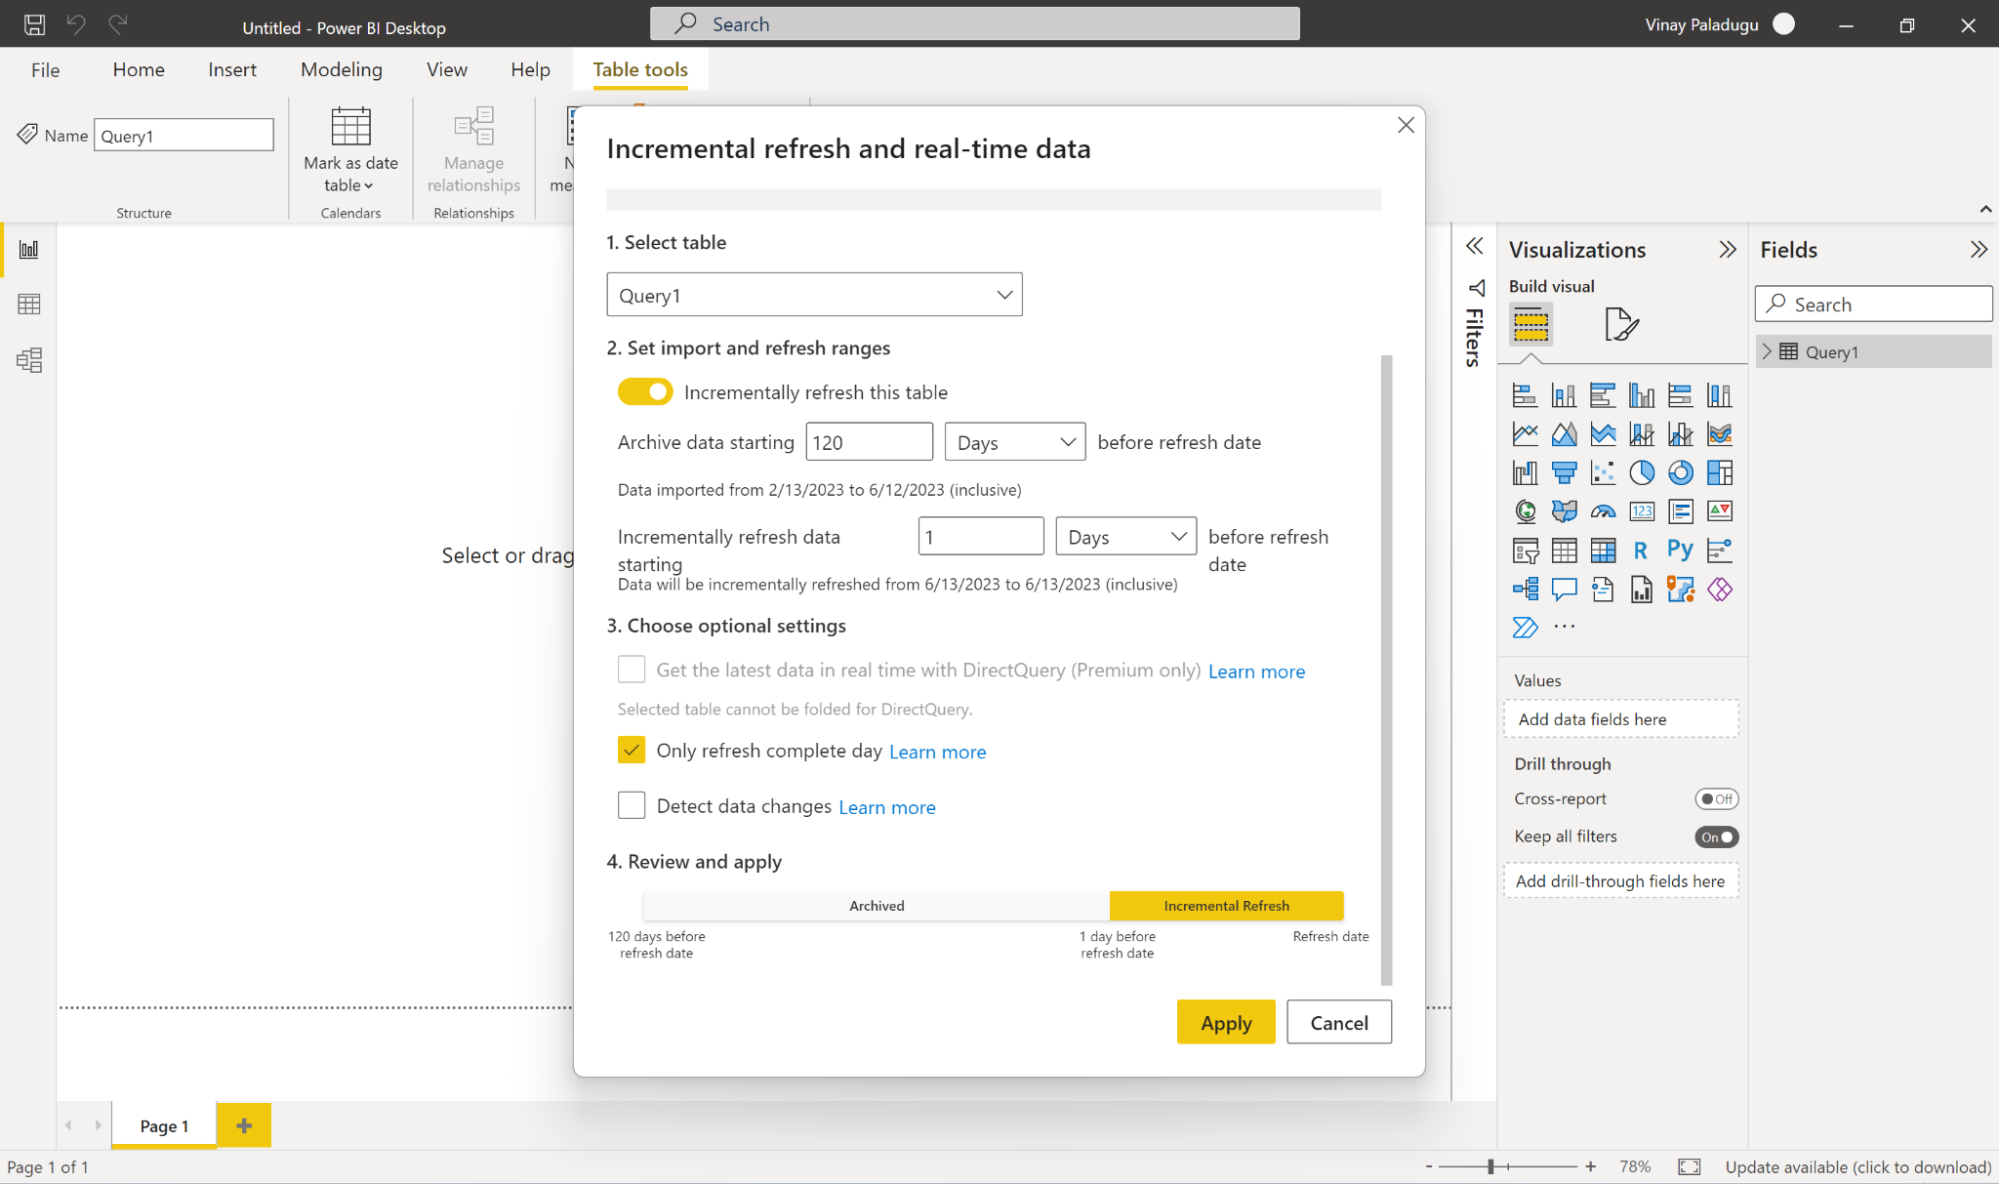
- Review your settings and then select Apply to complete the refresh policy.
This step won't fetch the data yet.
Step 5 - Build reports and visualizations
Create visualizations as required for your business case in this step. A few fields may need to be changed to an appropriate data type and converted to easy-to-comprehend units like milliliters to liters, meters to miles, etc.
Once the desired Report is created Save the PowerBI project.
For pre-built templates that are ready to use refer to our Plug-and-Play Power BI Templates!
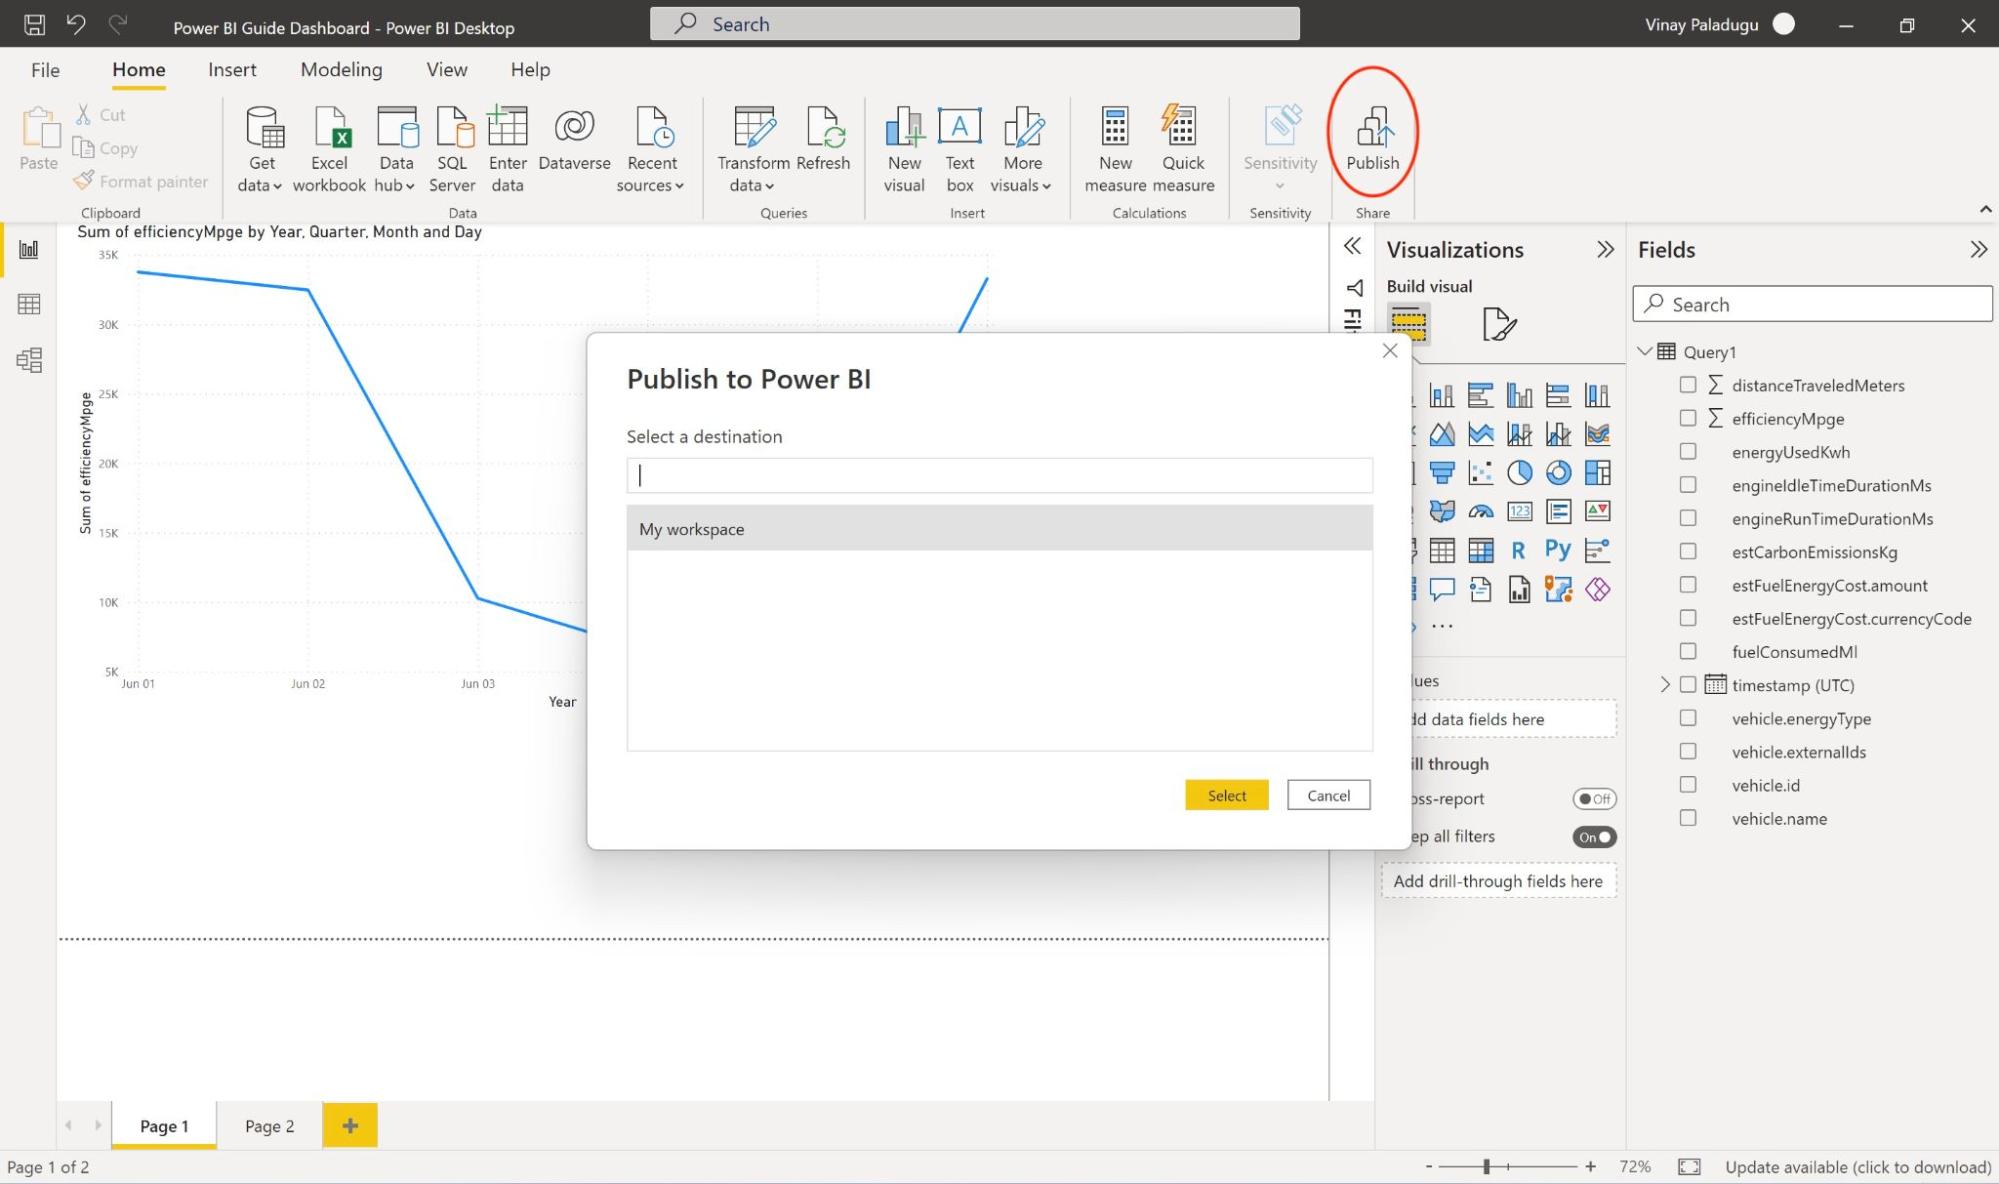
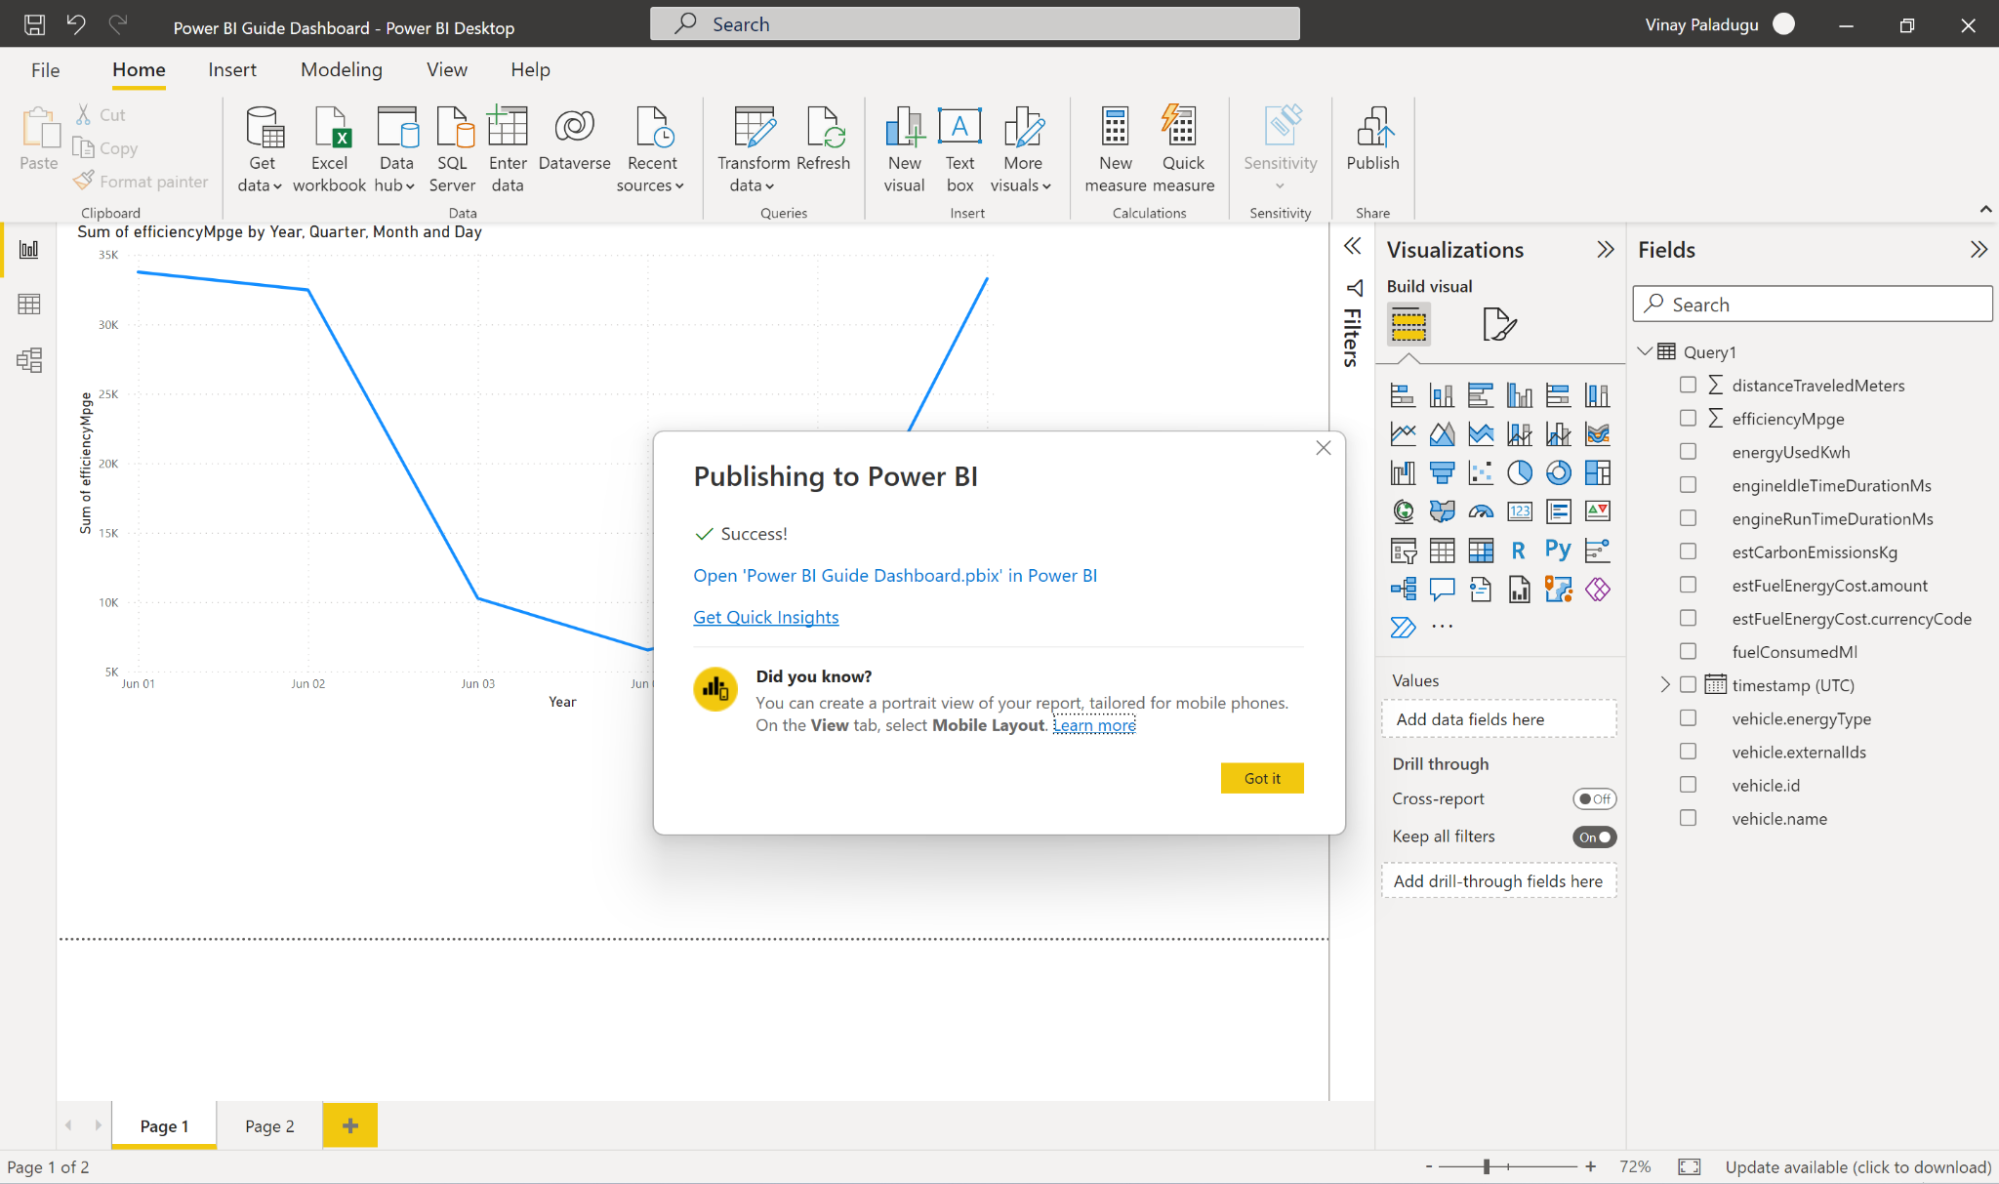
Step 6 - Publish report to Power BI Service
Now that your RangeStart and RangeEnd parameters, filtering, and refresh policy settings are complete, save your model, and then publish to the service.
On the Home ribbon in PowerBI, click on Publish, select a Workspace, and click on Select. The pop-up that appears next will give a URL to the deployed report.
Step 7 - Schedule data refresh
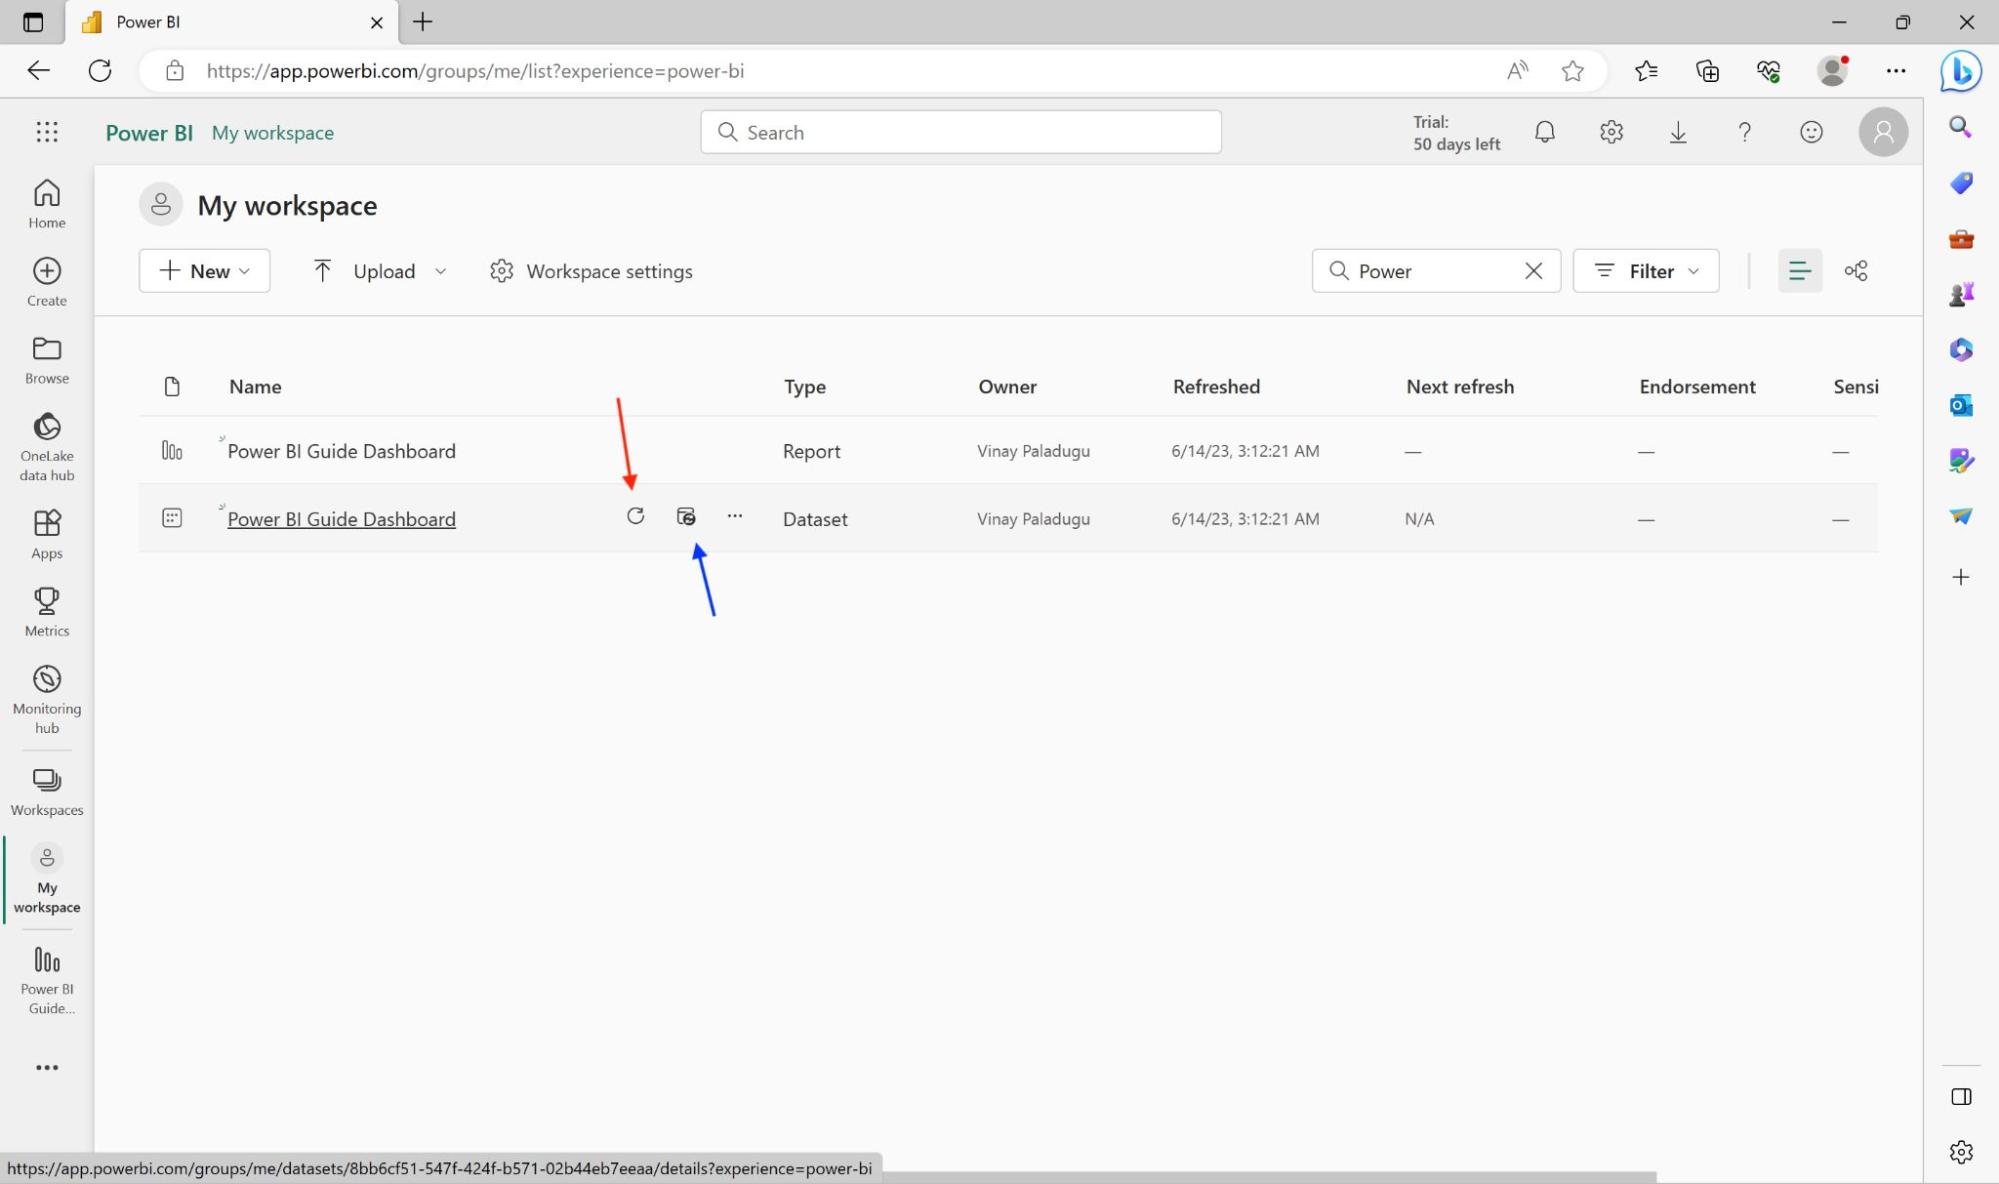
Now that the Report and Dataset have been deployed on PowerBI Service,
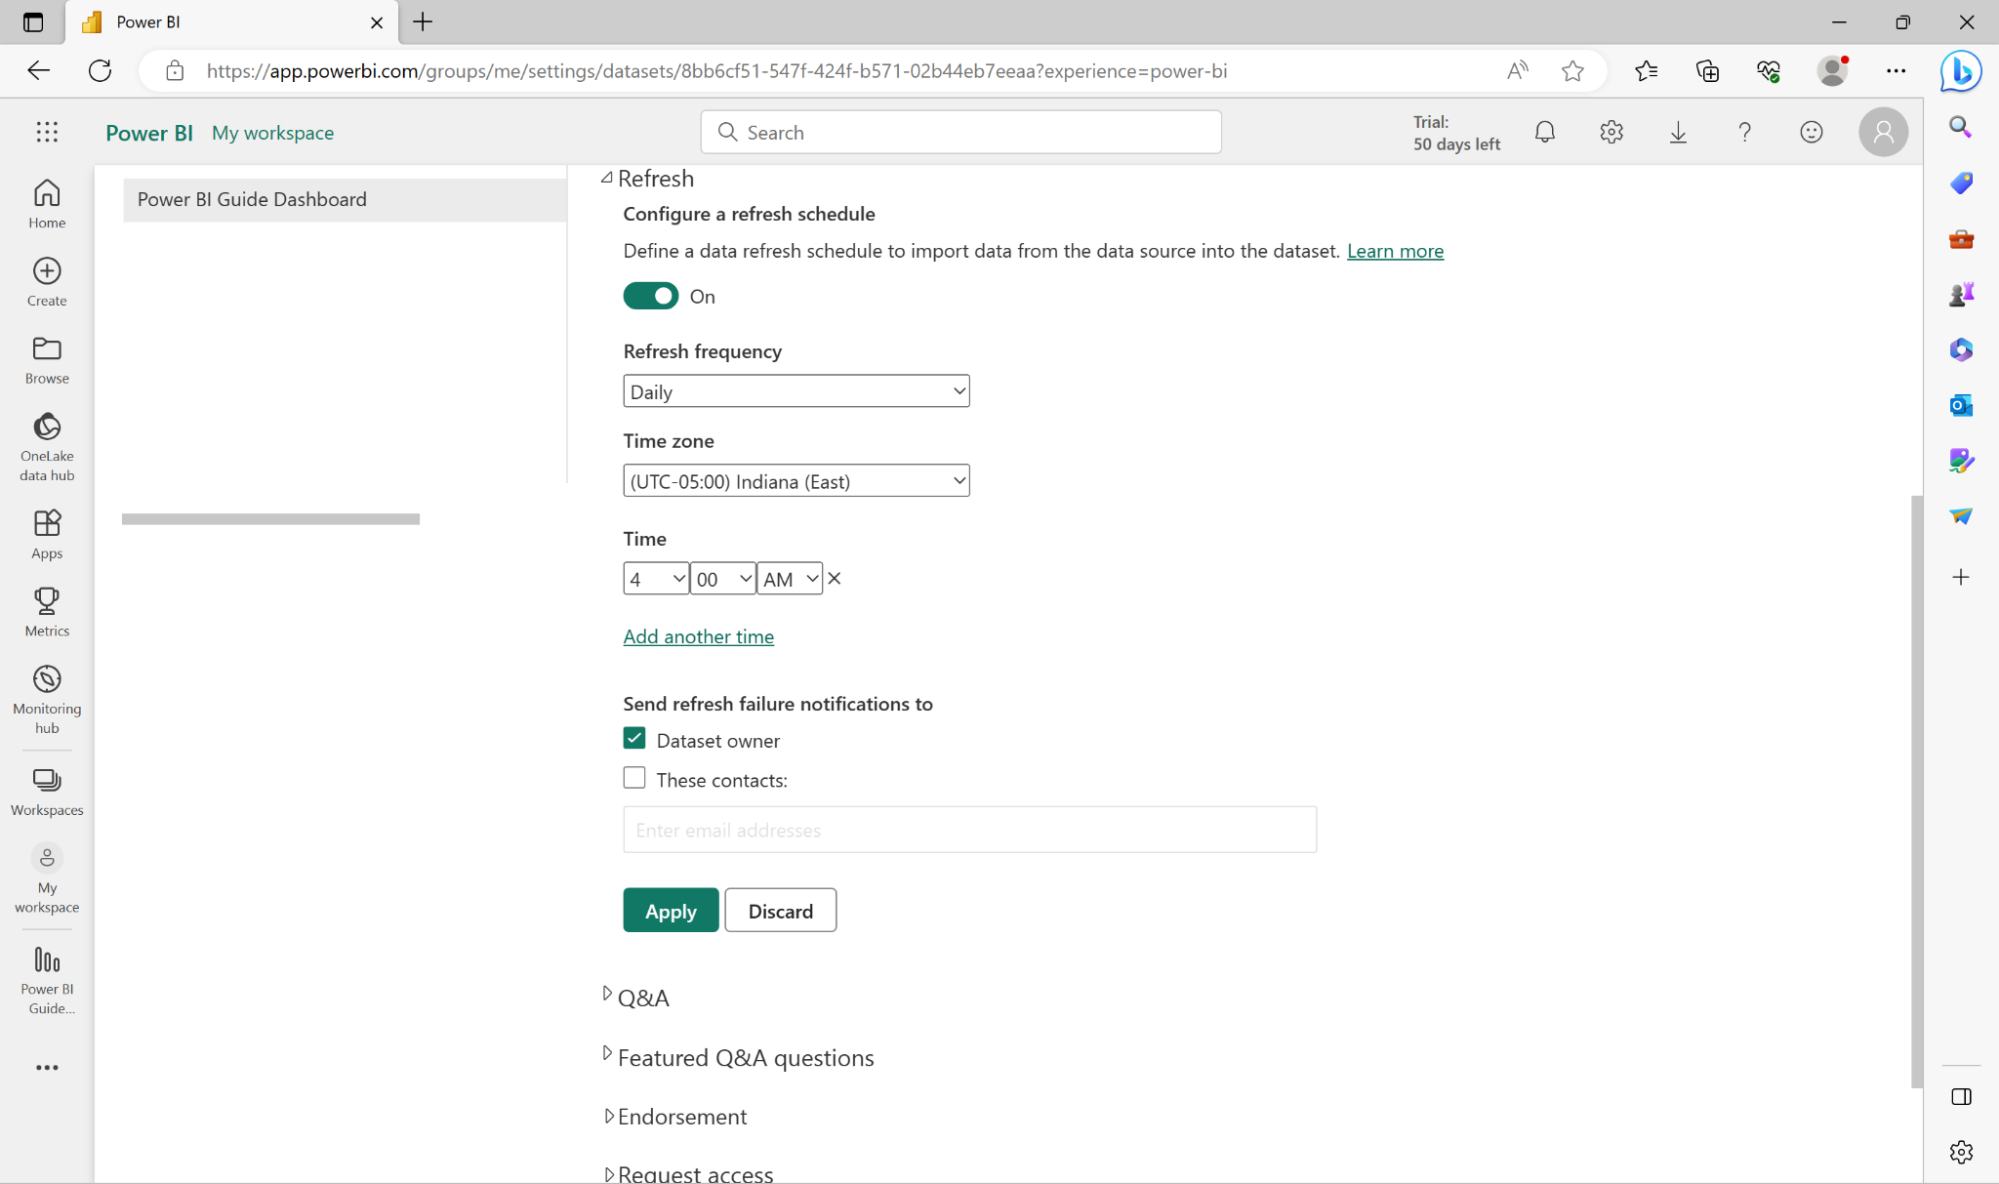
- Switch to Power BI Service and navigate to My Workspace where you will find the Report and Dataset.
- Trigger a manual refresh by clicking on the icon the red arrow is pointed at to fetch all the data for the last 120 days.
 This step may take a long time depending on the number of vehicles on your dashboard.
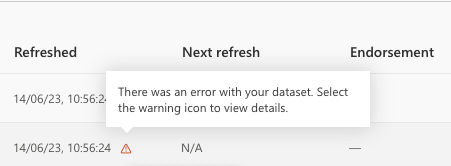
If you receive an error message when refreshing your data set please follow the steps below.
- Go to the three dots next to your dataset and Settings.

- Then go to Data source credentials > Edit credentials. This will open a box to Configure Incremental Refresh.
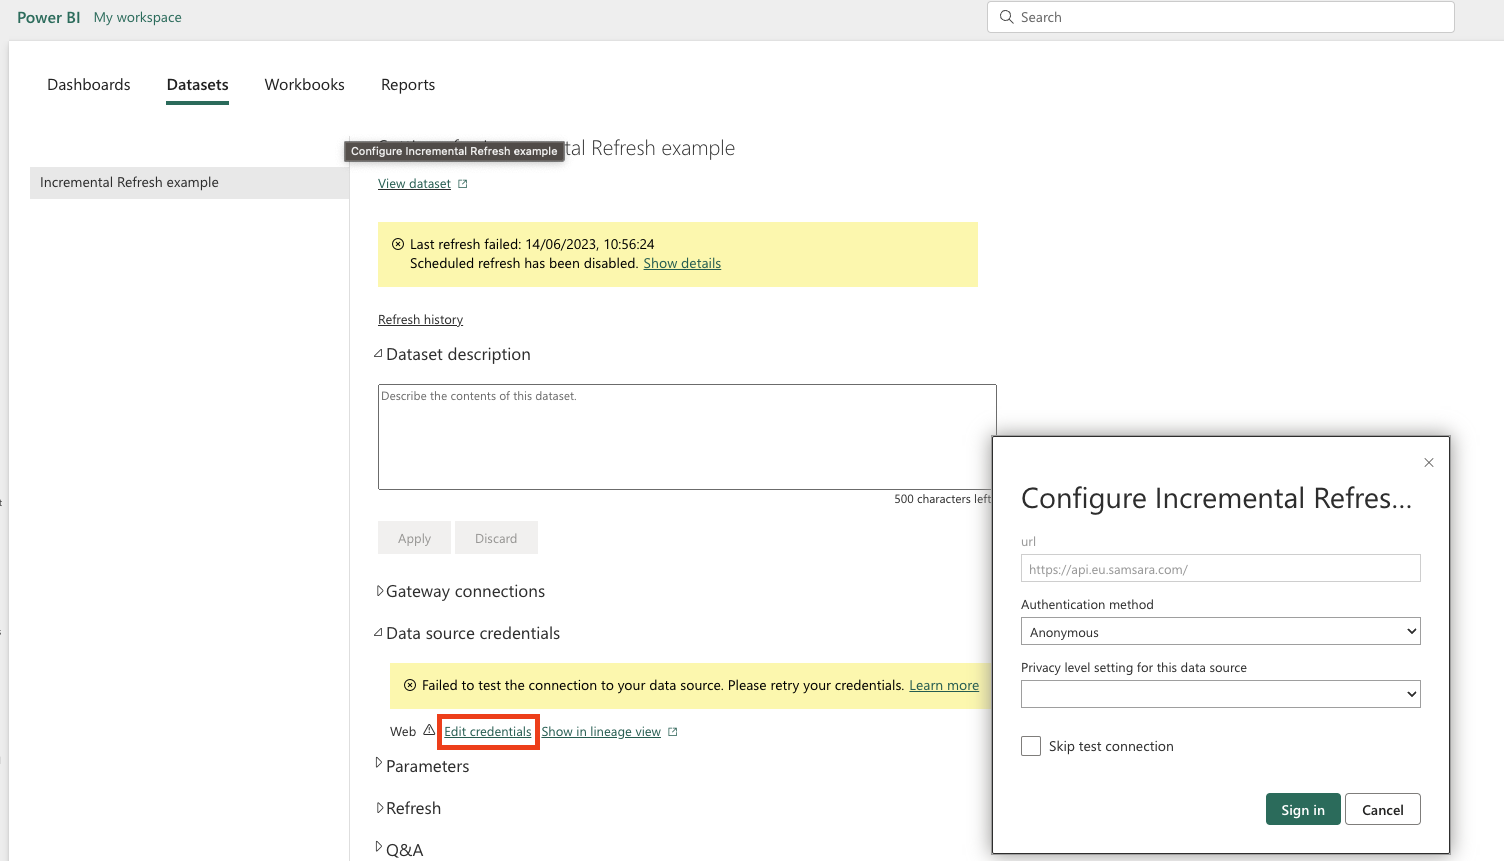
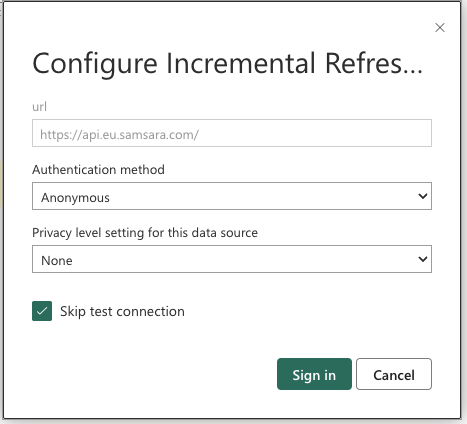
- For the Authentication method select “Anonymous”, for Privacy level setting for this data source set it to None and ensure the skip test connection box is ticked.
- After the initial refresh is complete, schedule a daily refresh at a desired time of the day by clicking on the icon the blue arrow is pointed at in the screenshot.

Packaging and Deploying a Connector
The Microsoft M video in this guide goes over these details from 34:46 onwards. Here you will learn how to take the work you've done in Power BI desktop and make the Samsara data source available for your business analysts to build dashboards within the Power BI service (the cloud version of Power BI focused on data analysts vs builders.
Limitations
Samsara collects a large volume of data. Depending on the API endpoint you use, you may be retrieving a large volume of data that could hit the default storage limitation that different Power BI tiers have. For example, Samsara's GET /fleet/vehicles/stats API returns dense GPS data per vehicle.
When building out your connector, be sure to validate how much historical data you are looking to query from Power BI. Based on this analysis, you may find it more economical to build out a data warehouse by calling Samsara APIs and then connecting that data warehouse to Power BI instead of a direction connection to Samsara via a custom Power BI connector. For use cases that need to visualize the last many historical days of data, the custom connector approach discussed thus far may not be the most efficient since it requires retrieval of the entire dataset every day. For such use cases refer to the the Incremental Refresh guide.
Plug-and-Play Power BI Templates
What is a Template?A template is pre-built package that can be downloaded and immediately used. New templates may be regularly developed and added so stay tuned!
The benefit of these templates is you can start with a shell of a connector and a matching dashboard, and then enhance from there.
Template 1: Vehicle Fuel and Energy
This template allows you to view Fuel and Energy data for your fleet.
You will be provided with an insight into the total active vehicles over the last 120 days and the total distance traveled, fuel consumed, engine idle time, carbon emissions, fuel economy, and energy used by them along with the total fuel and energy cost.
There is a scorecard to provide a comparison between the last two full months of data regarding Fuel Economy, Fuel Usage, Idling, and Carbon Emissions for your fleet. You will also be able to view the comparison between the last two full months of data.
There are built-in filters to allow you to select specific vehicles by Name, VIN, Make, Model, or Year.
Download the template from the following link!
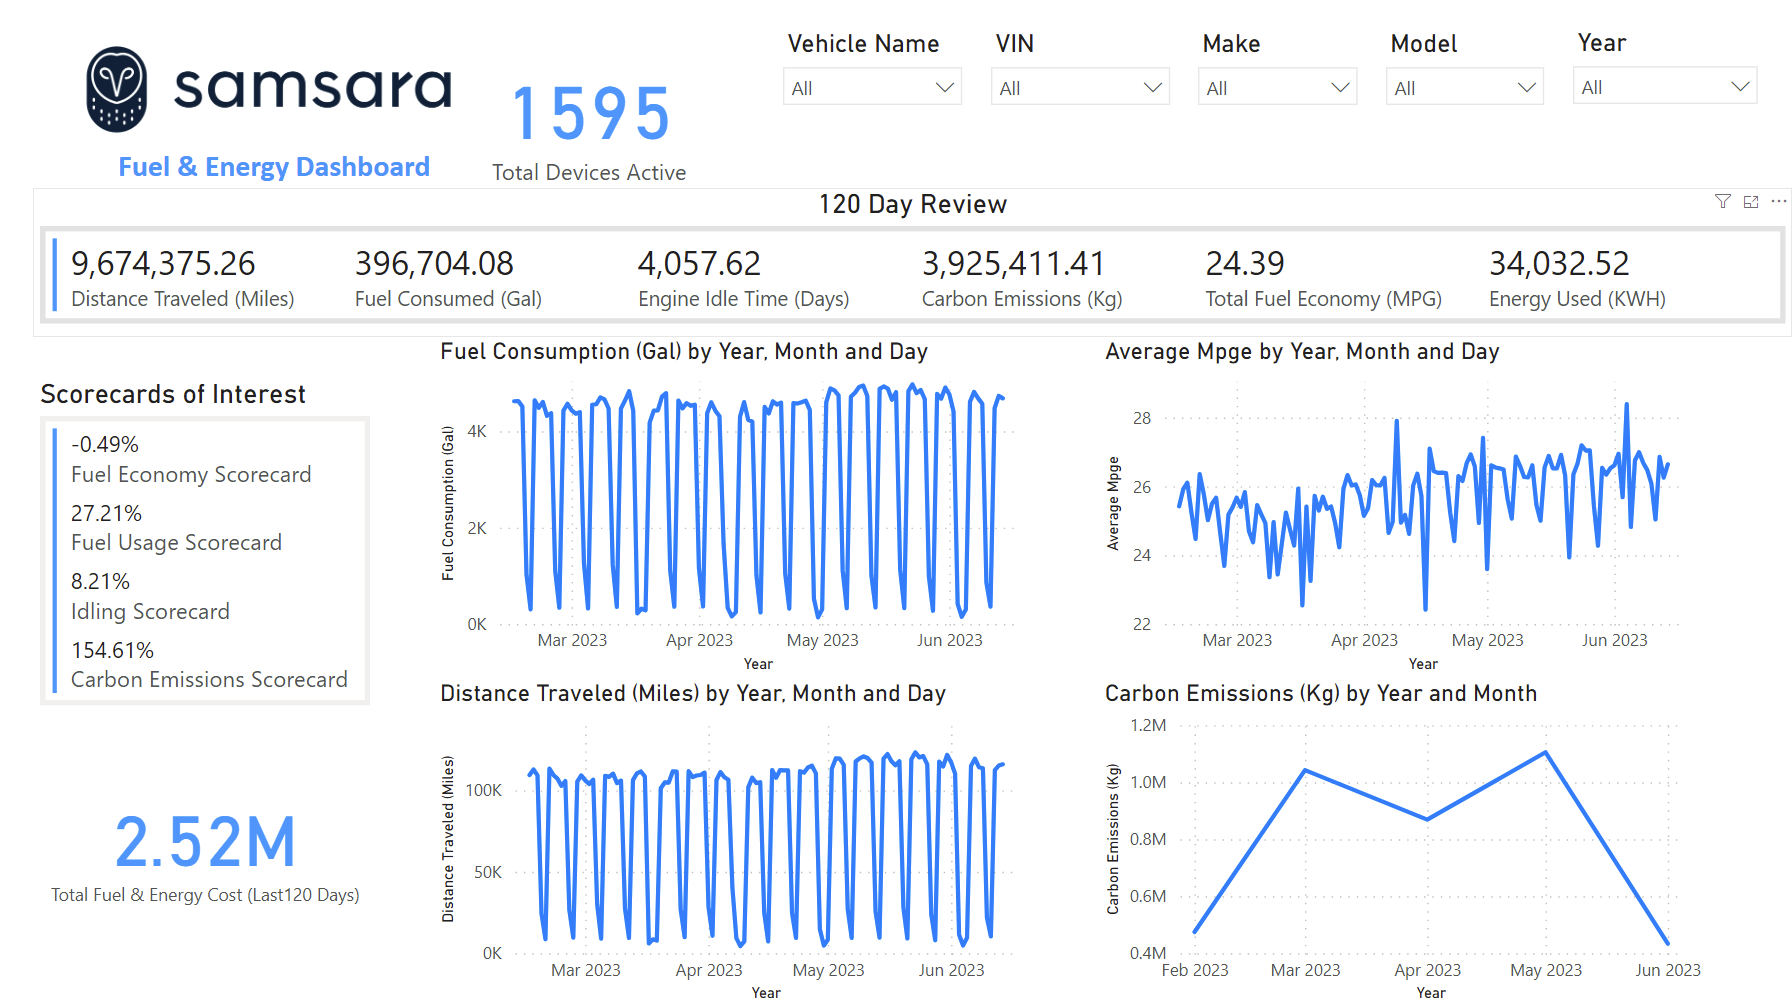
Note on UnitsBy default, any reference to Gallon refers to the US Liquid Gallon (including MPG). Please refer to the Template Unit Conversions section for information on how to convert units accordingly.
Configuring the Template
In order for the template to be used correctly there are a few parameters that need to be configured.
- After downloading the template, open it in PowerBI Desktop.
- You will be prompted to define the following parameters: RangeStart, RangeEnd, apiToken, samsaraURL, and Dashboard Timezone.
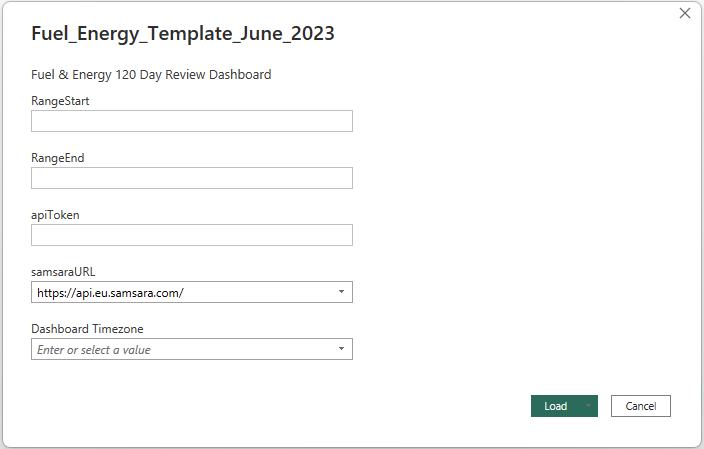
- Once you have defined the parameters hit Load.
- Your dashboard will use the parameters you've defined to obtain data from Samsara's APIs. Depending on the number of vehicles in the dashboard the refresh can take a long time.
Defining the Parameters
- RangeStart will be the start of the data collection window in the format: YYYY-MM-DD. This should be 120 days before RangeEnd for Incremental Refresh.
- RangeEnd will be the last day you want to obtain data for in the format: YYYY-MM-DD. Usually this will be the date today.
- apiToken is your Samsara API token with the correct read permissions for the data you want to pull.
- samsaraURL is the Samsara Dashboard URL for your organisation.
- Dashboard Timezone is the Timezone you want to use for your dashboard. Check the list below for the currently supported timezones.
Currently Supported Timezones
Timezone Abbreviation Timezone Name UTC Offset UTC Coordinated Universal Time 0 GMT Greenwich Mean Time 0 WET Western European Time 0 BST British Summer Time +1 CET Central European Time +1 WEST Western European Summer Time +1 EET Eastern European Time +2 CEST Central European Summer Time +2 AST Arabia Standard Time +3 GST Gulf Standard Time +4 EDT Eastern Daylight Time -4 EST Eastern Standard Time -5 CDT Central Daylight Time -5 CST Central Standard Time -6 MDT Mountain Daylight Time -6 PDT Pacific Daylight Time -7 MST Mountain Standard Time -7 PST Pacific Standard Time -8 AKDT Alaska Daylight Time -8 AKST Alaska Standard Time -9 HADT Hawaii-Aleutian Daylight Time -9 HAST Hawaii-Aleutian Standard Time -10 SST Samoa Standard Time -11
Other Timezones
- When selecting a timezone what really matters is the UTC Offset. If you don't see your specific timezone but see a timezone with the equivalent offset then you can use that timezone.
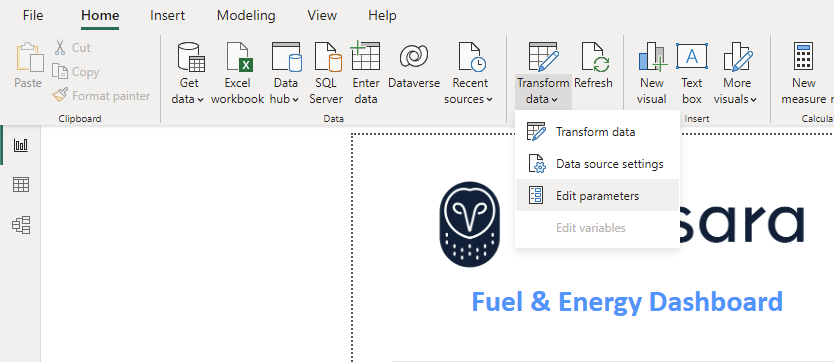
You can edit your template at any time to change any of the parameters.
- In the Home tab go to Transform Data > Edit Parameters
- Once you have defined the parameters hit OK. Your dashboard will prompt you to "Apply Changes".
- Your dashboard will refresh with the new data using the parameters you've provided.
Edit Parameters in your Existing Dashboard

Accept Changes to Load the Changes in the Dashboard
Unit Conversions
By default the templates provided may be using different units to what is desired. Please pay attention to the table below to convert to the desired units.
Ensure you are converting to the correct units!
Starting Unit Conversion Unit Formula Gallon (US) Imperial Gallon (UK) Imperial_Gallon = Gallon / 1.201 Gallon (US) Liter Liter = Gallon * 3.78541 MPG (US Liquid Gallon) MPG (UK Imperial Gallon) MPG_Imperial = MPG_US * 1.201 MPG (US Liquid Gallon) Liter per 100 km 235.215 / MPG Miles Kilometers Km = Miles * 1.60934 Kilogram Imperial Ton Imperial Ton = Kg / 1016 Kilogram US Ton US Ton = Kg / 907.2 Kilogram Metric Ton Metric Ton = Kg / 1000
Updated 9 months ago