Developer Metrics
Developer Metrics is a page you can visit to review your integration's health over time, iterate during early stages of development, and dig into request to diagnose potential integration issues. You can view API traffic and Webhook traffic. In order to view the page you must:
- Be a Full Admin or Standard Admin, or
- Have the Developer Metrics custom permissions selected for your role
API Traffic
Review API Health Metrics
At the top of the page, you can review API volume for the last 30 days and review your Availability Rate and Success Rates. The metrics and graph will adjust when you select different filters and date ranges so that you can narrow in to get more specific insight.
- Availability Rate: the % of non-5xx status codes received from the API
- Success Rate: the % of 2xx status codes received from the API
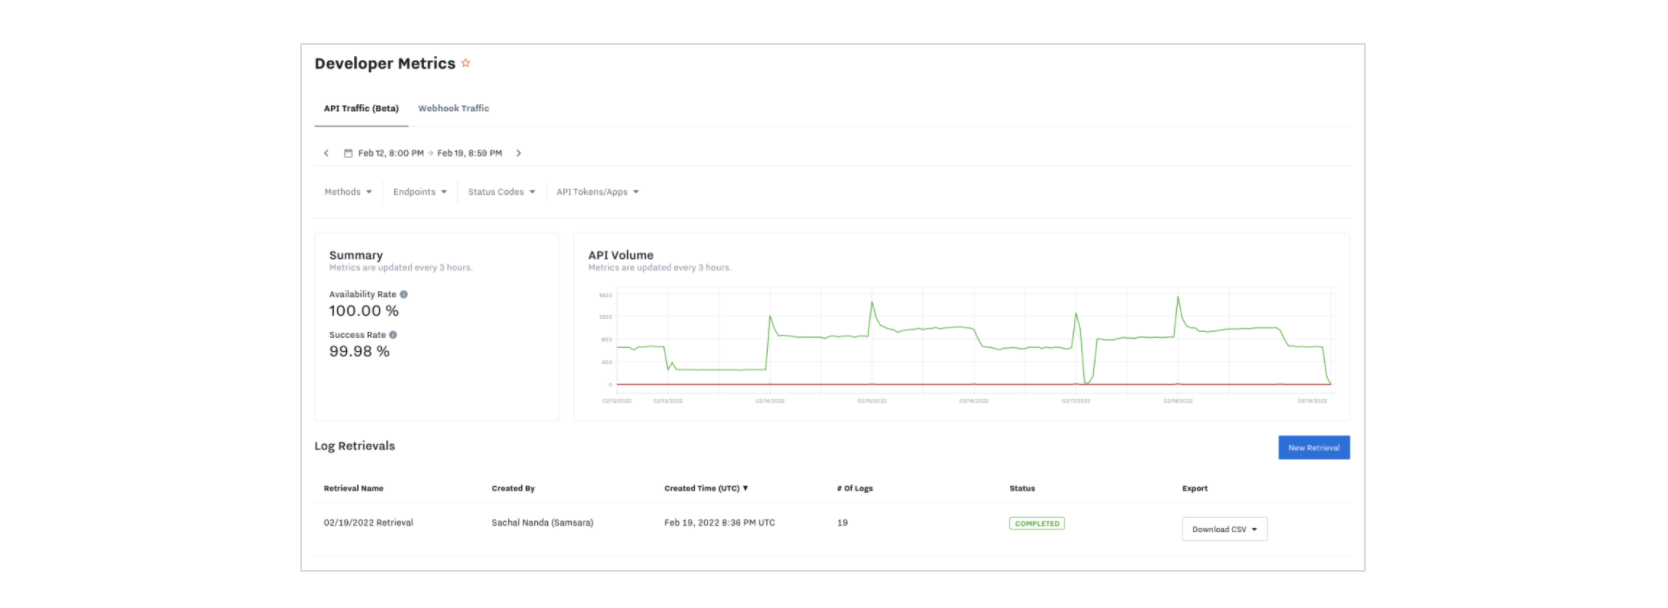
Retrieve Specific API Logs
Click "Log Retrieval" to request a set of API Logs. Within the retrieval pop-up, you can select specific status codes, methods, endpoints, or API tokens/Apps within a specific date range. Once submitting this retrieval, it will take about 5 minutes to complete
- If you have already selected filters in the graph, those filters will be carried over.
- Select "send email once retrieval is complete" if you like an email to be sent once the retrieval completes
- Your retrieval will last for 60 days from the creation date. After this time has passed, your retrieval will be automatically deleted.
Pulling Logs is Near Real-timeAn API request may take up to 30 minutes after it is made to be able to be retrieved from Developer Metrics. For example, if a request is made at 10:00 AM, be sure to wait until 10:15 AM until you attempt to pull that API log.
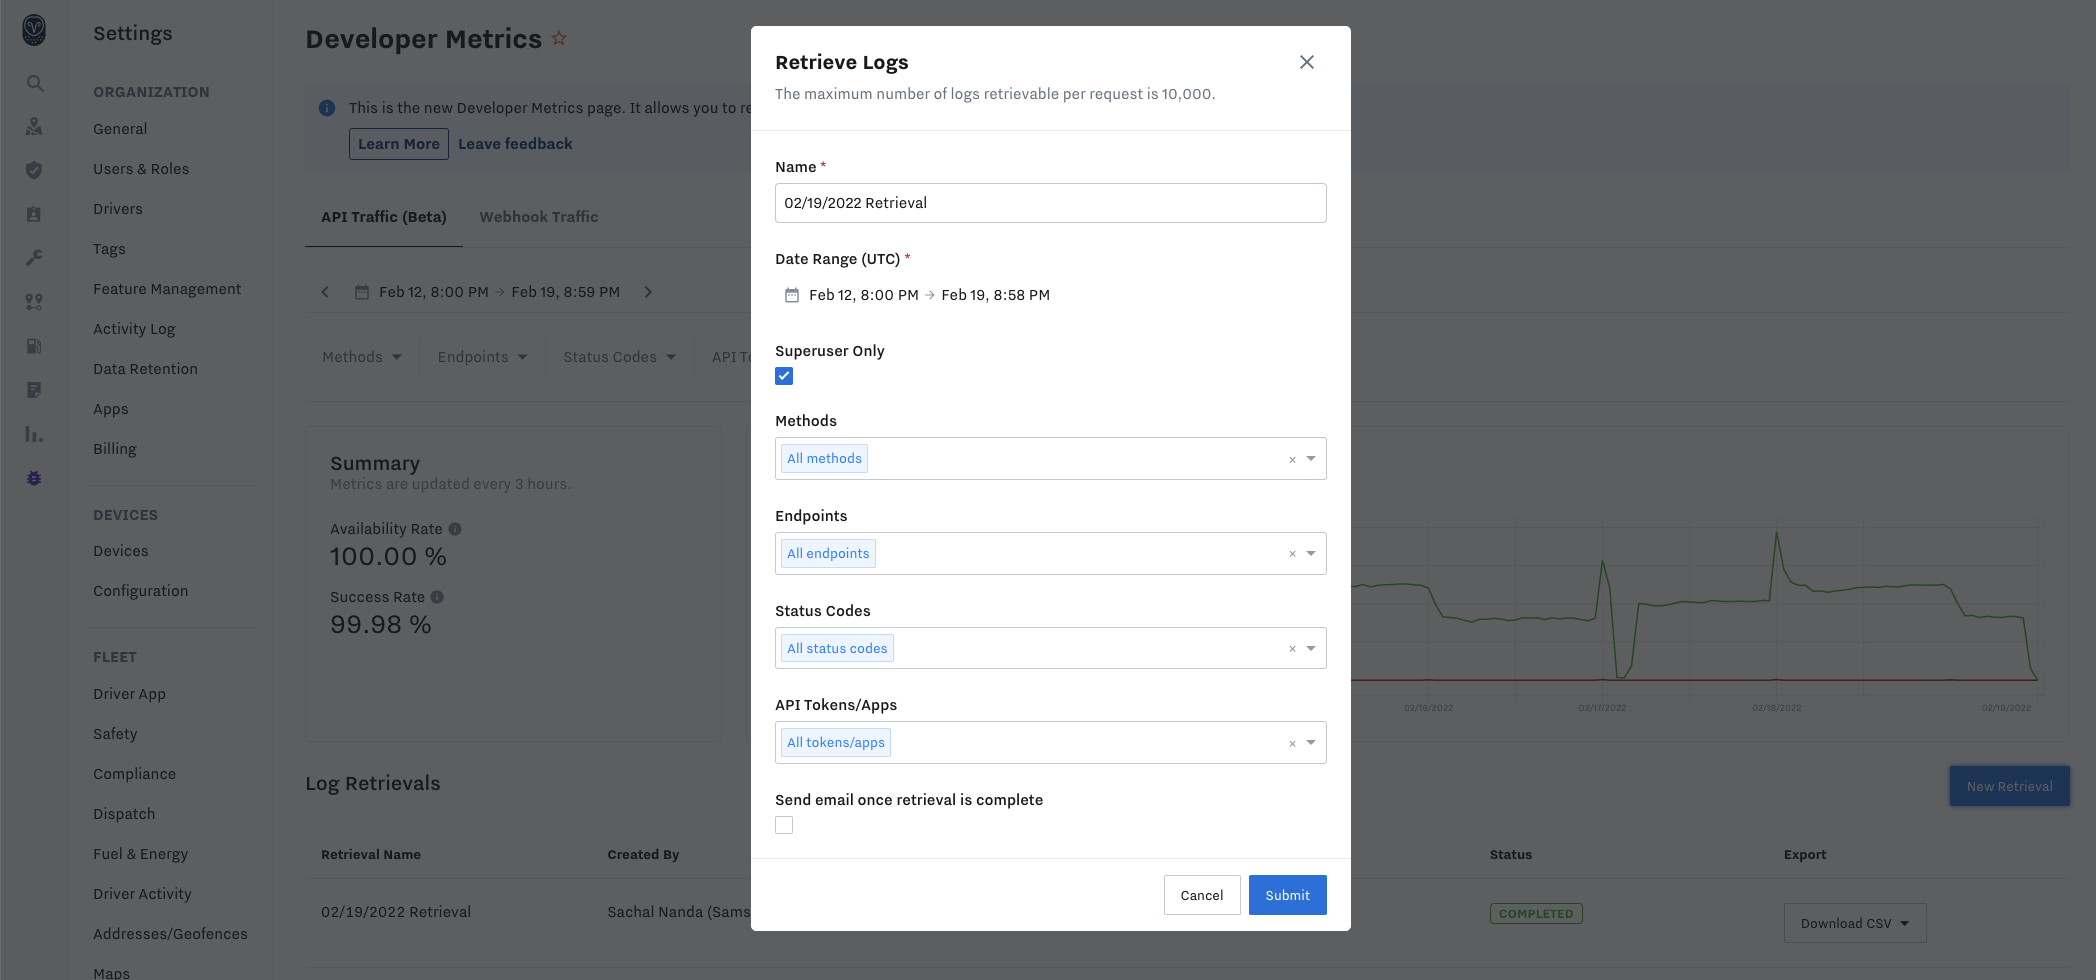
The maximum number of logs we return is 10,000 API logs. If your retrieval includes more than 10,000 logs, we will return the most recent 10,000. We recommend trying to select a smaller time range and adding more filters when submitting the retrieval in order to reduce the size.
View Your API Log Retrieval
Once your retrieval is complete, you can export two types of CSVs:
- Full results - This returns all the data, including the request and response body. If the log retrieval’s response body is greater than 1MB, the response body will not be included
- Excel friendly - This returns the data within the character limits for Excel. You may notice that some of your request and response bodies will be cut off in order to support importing into Excel.

In addition to the CSV export, you can click into a specific retrieval and see all the logs for that retrieval in the dashboard. Within this page, you can filter across the logs and search by Request ID. You can then click into a specific request and view the details for that request.
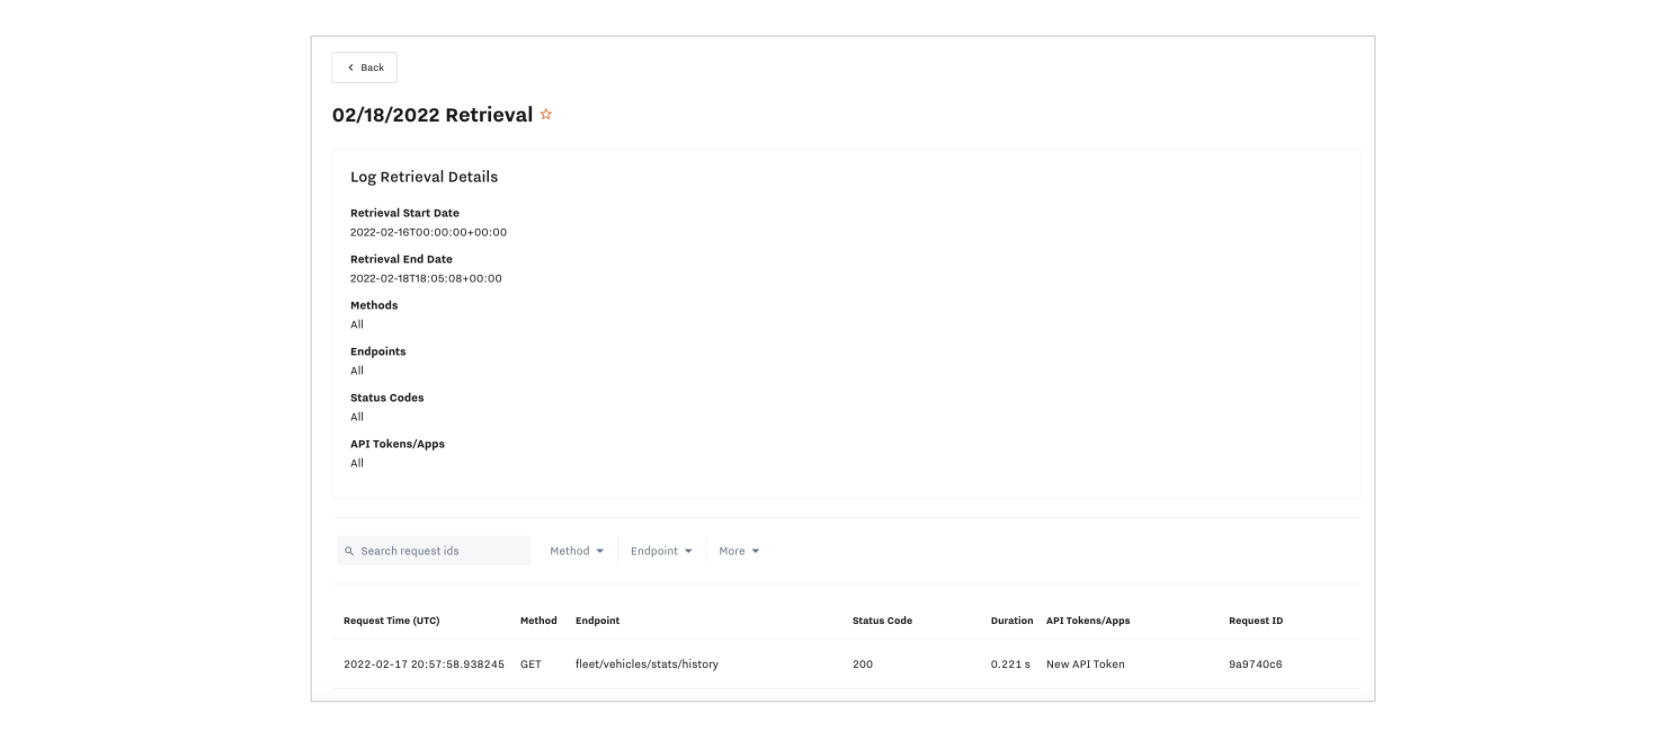
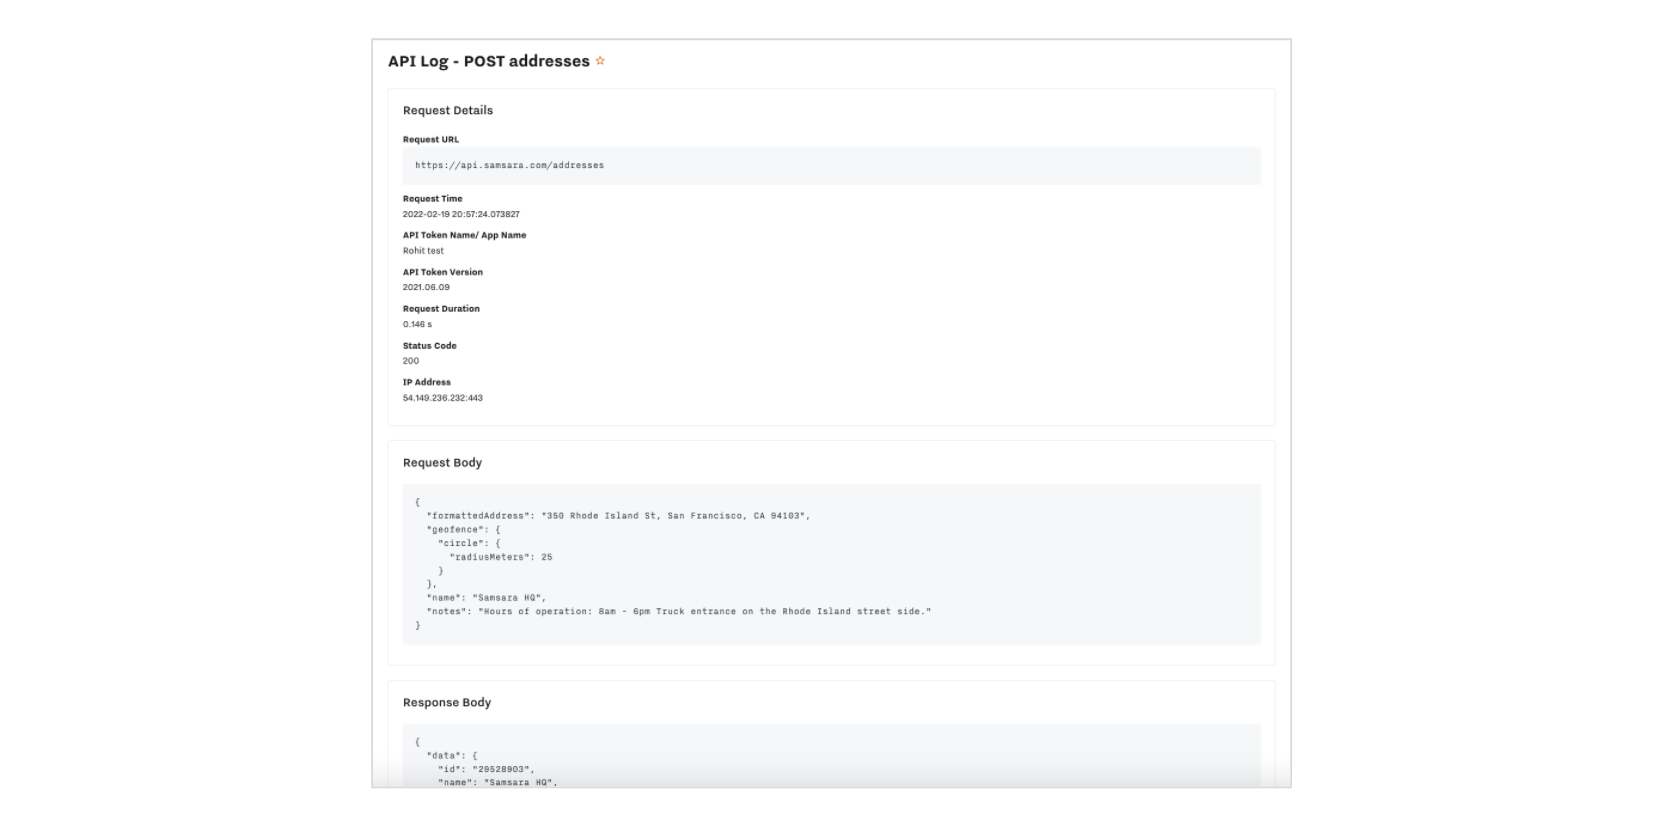
Pro Tip: Use Request IDsIn the search box you can search for a specific log using it's Request Id. This is an efficient way to find a specific log you want to view the request ID can be found in the header of every API response, and it can also be found as a column in the CSV export
Webhook Traffic
Review Webhook Health Metrics
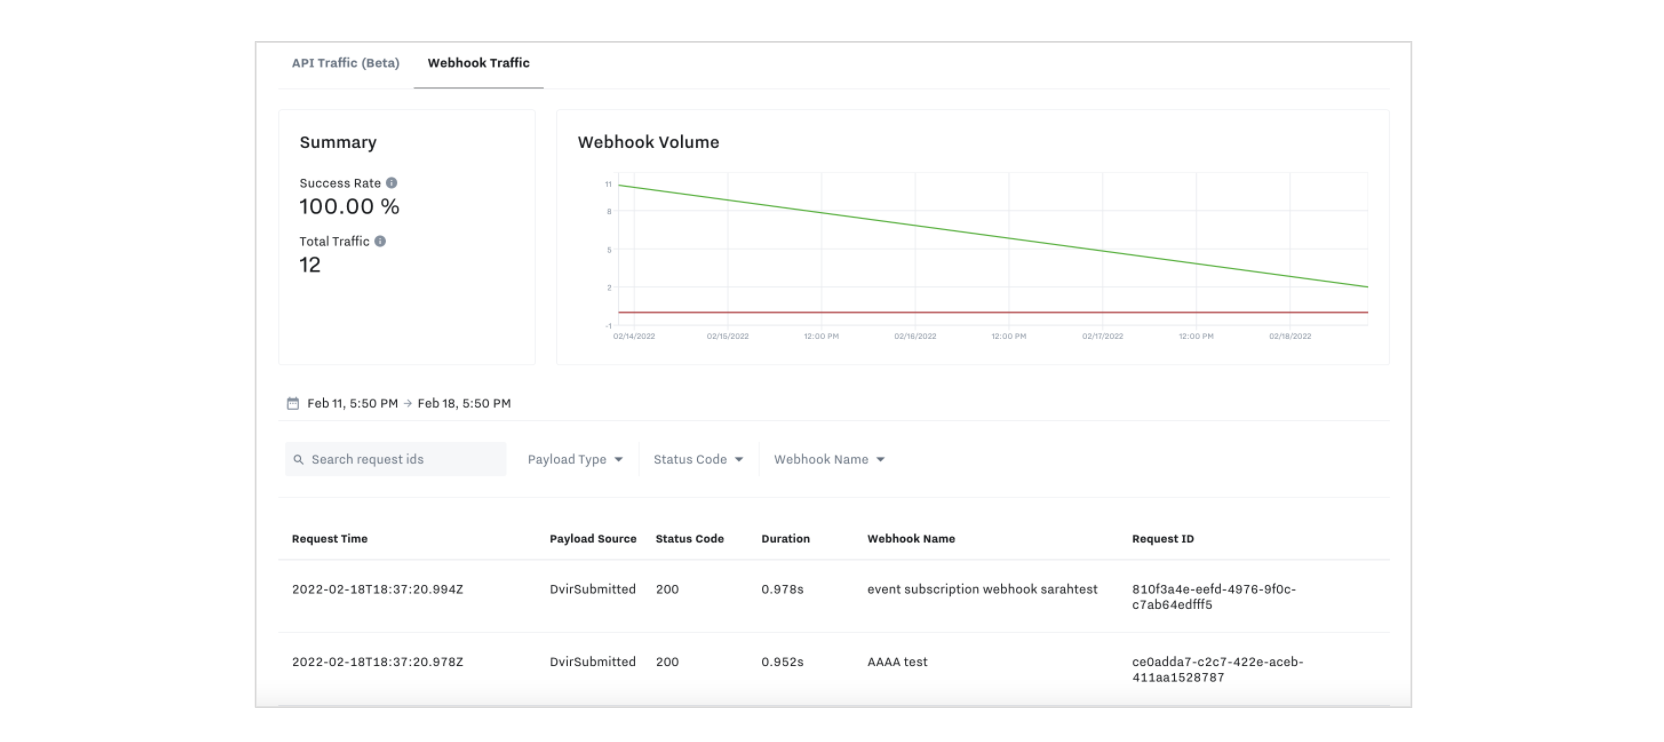
At the top of the page, you can review Webhook volume for the last 7 days and review your Success Rate and Total Traffic. The metrics and graph will adjust when you select different filters and date ranges so that you can narrow in to get more specific insight.
- Success Rate: the % 2xx status codes received by the webhook after it is sent
- Total Traffic: the total number of webhook events sent
View Specific Webhook Logs
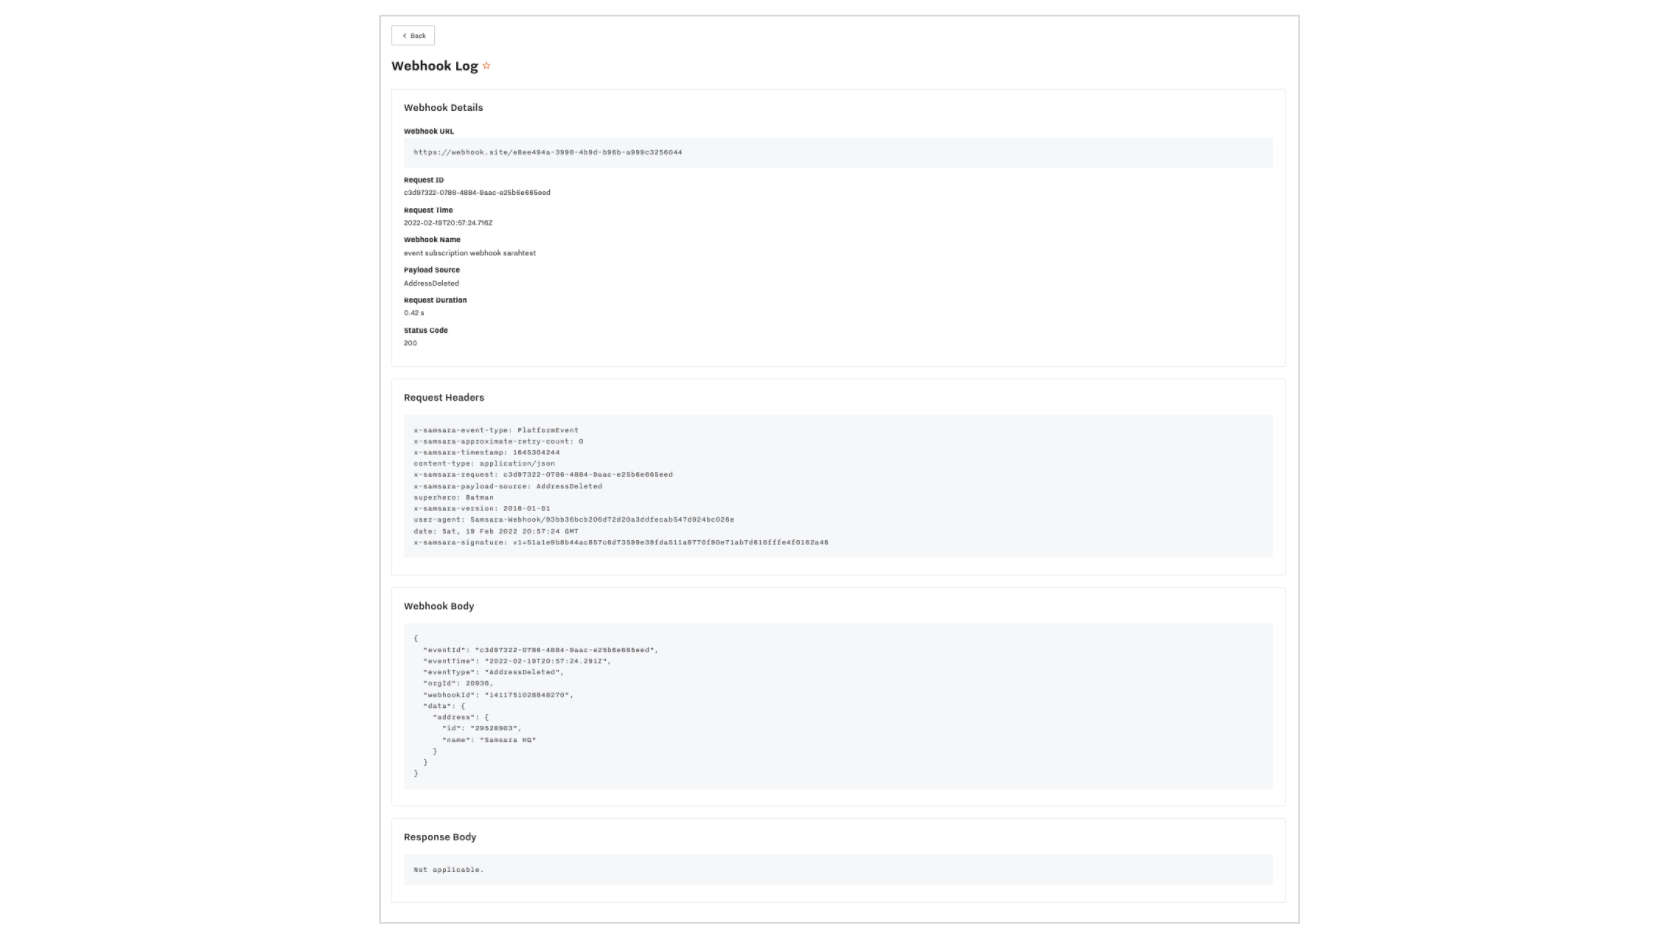
The same page filters will filter the table at the bottom of the page. Once you've narrowed your scope, you can click into a specific webhook and view the details for that webhook.
Updated 7 months ago
